 EUROPEAN COMMISSION
Brussels,1.6.2018
SWD(2018) 301 final
COMMISSION STAFF WORKING DOCUMENT
IMPACT ASSESSMENT
Accompanying the document
Proposals for a
- Regulation of the European Parliament and of the Council establishing rules on support for strategic plans to be drawn up by Member States under the Common agricultural policy (CAP Strategic Plans) and financed by the European Agricultural Guarantee Fund (EAGF) and by the European Agricultural Fund for Rural Development (EAFRD) and repealing Regulation (EU) No 1305/2013 of the European Parliament and of the Council and Regulation (EU) No 1307/2013 of the European Parliament and of the Council
- Regulation of the European Parliament and of the Council on the financing, management and monitoring of the common agricultural policy and repealing Regulation (EU) No 1306/2013
- Regulation of the European Parliament and of the Council amending Regulations (EU) No 1308/2013 establishing a common organisation of the markets in agricultural products, (EU) No 1151/2012 on quality schemes for agricultural products and foodstuffs, (EU) No 251/2014 on the definition, description, presentation, labelling and the protection of geographical indications of aromatised wine products, (EU) No 228/2013 laying down specific measures for agriculture in the outermost regions of the Union and (EU) No 229/2013 laying down specific measures for agriculture in favour of the smaller Aegean islands
{COM(2018) 392 final}
{COM(2018) 393 final}
{COM(2018) 394 final}
{SEC(2018) 305 final}
Annexes
Table of contents
Annex 5: Results of quantitative and Multi Criteria Analysis
1.
Introduction
2.
Results of quantitative analysis
2.1.
Support viable farm income and resilience across the EU territory
2.2.
Increasing the environmental and climatic benefits of the CAP
3.
Multi Criteria Analysis
3.1.
Introduction
3.2.
Effectiveness of policy options
3.3.
Efficiency of the policy options: simplification
3.4.
Promoting knowledge and innovation in agriculture and rural areas: Modernisation
3.5.
Policy coherence
3.6.
Cross cutting: Improving sustainable development for farming, food and rural areas
Annex 5.1 Policy options for the IA
1.
Elements common to all options
1.1.
Budgetary framework
1.2.
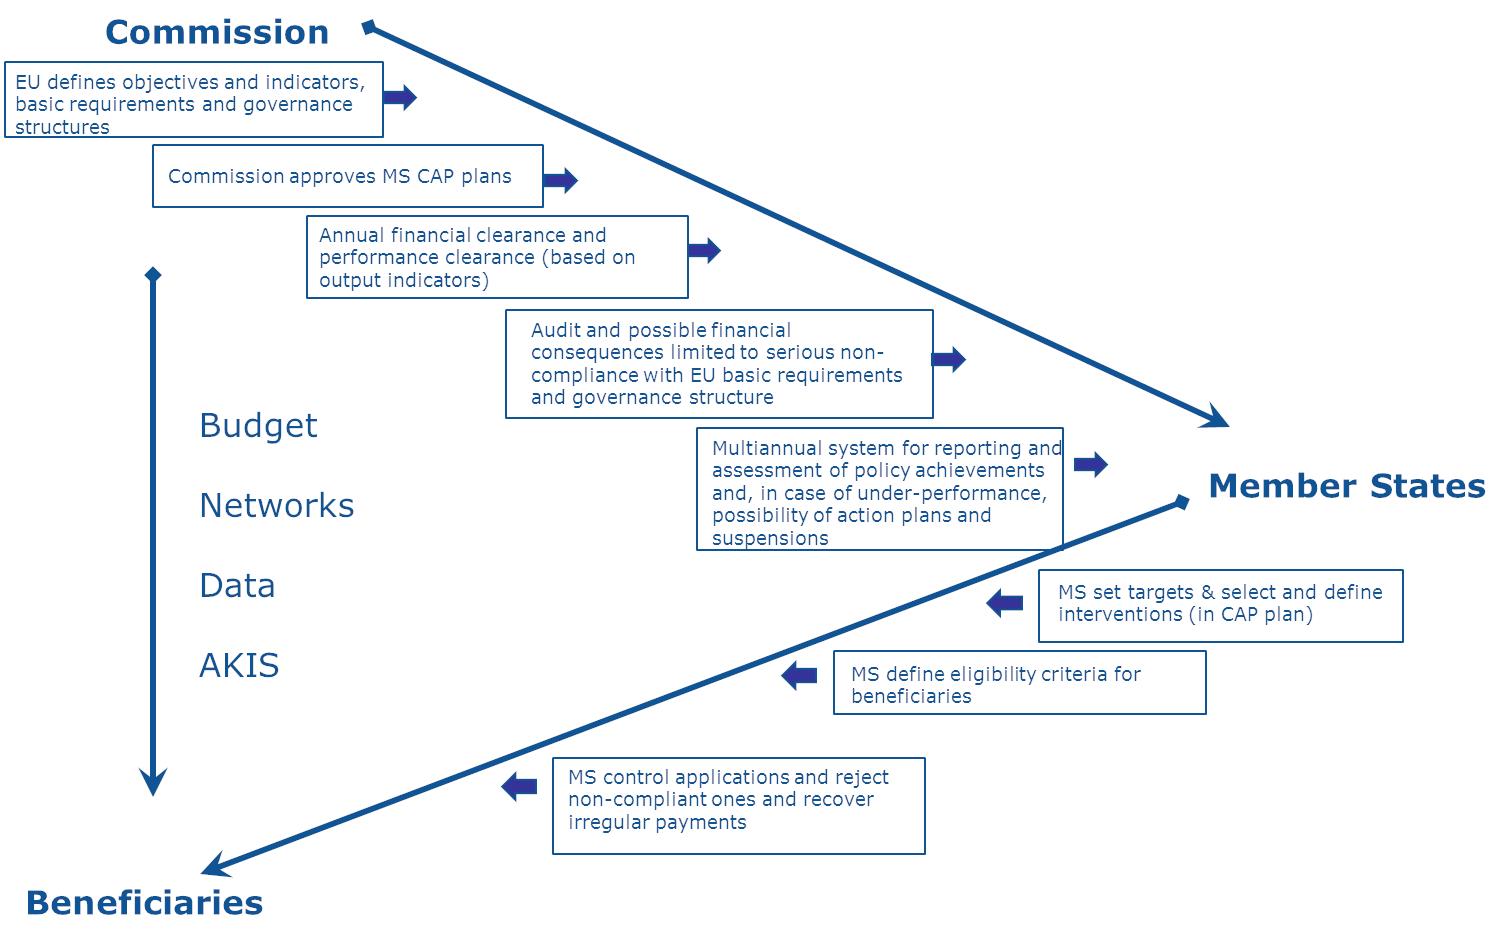
Delivery model and planning
1.3.
Knowledge, innovation and technology
1.4.
Market-related measures
1.5.
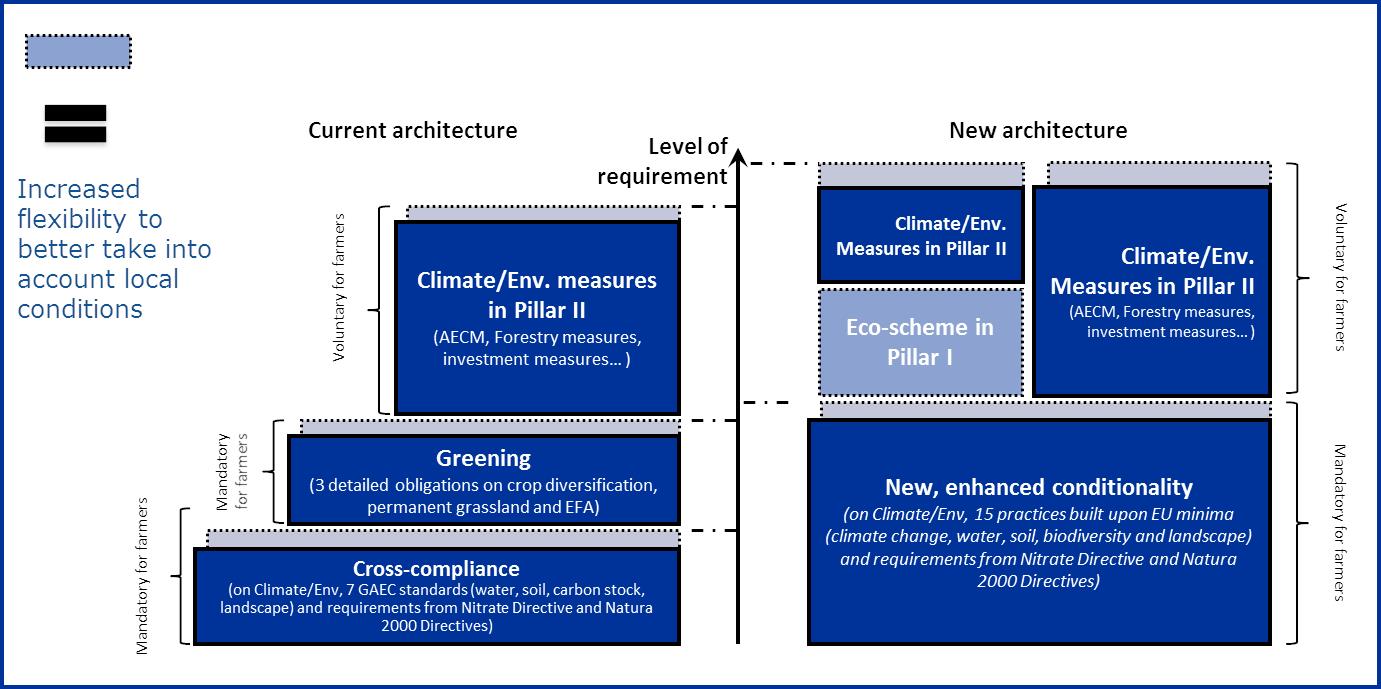
Conditionality and green architecture of the CAP
2.
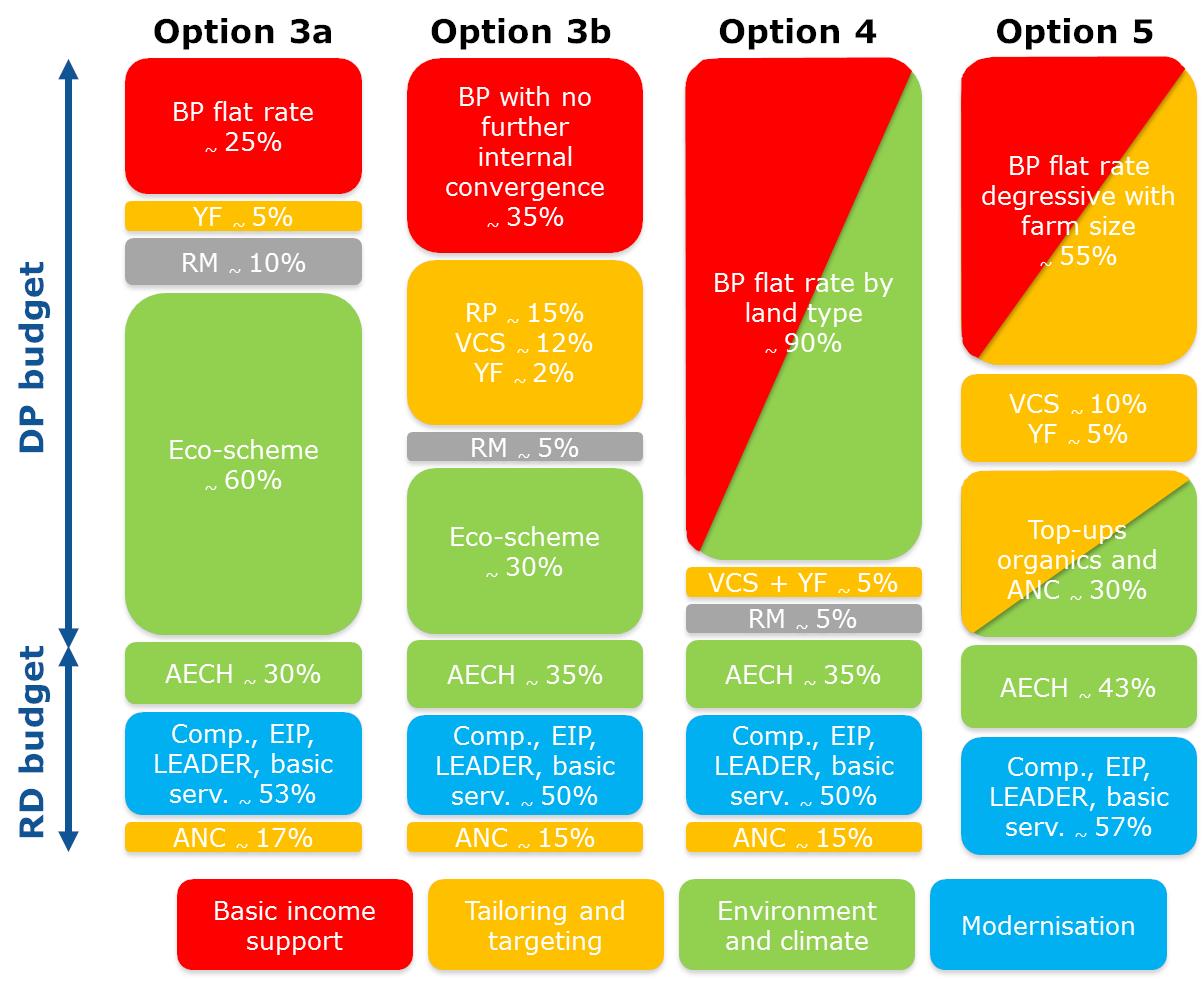
Options description
2.1.
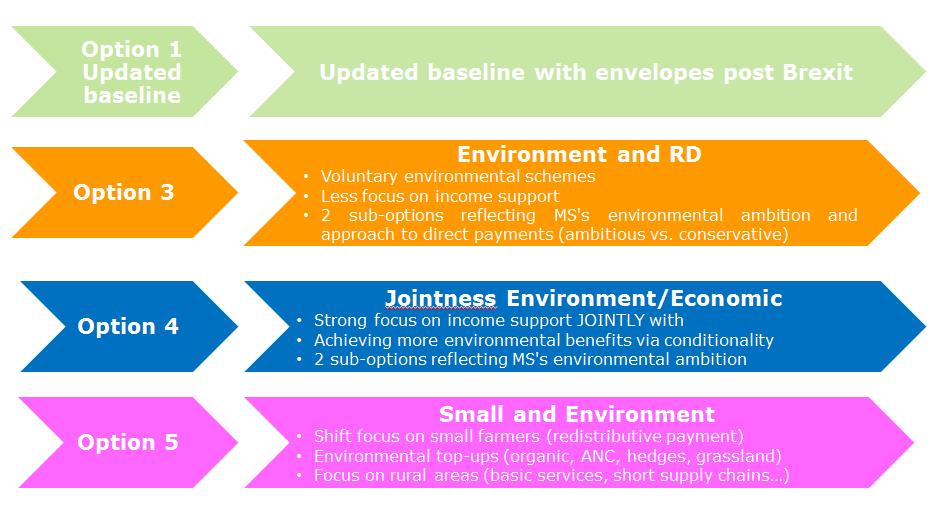
Option 1: Updated baseline
2.2.
Option 3: Incentives for environment, climate action and health
2.3.
Option 4: Jointly address environmental and economic sustainability
2.4.
Option 5: Focus on small farms and the environment
Annex 5.2 Methods and tools
1.
Introduction
2.
Brief description of the main models and tools used in the IA
2.1.
MAGNET
2.2.
Aglink-Cosimo
2.3.
CAPRI
2.4.
IFM-CAP
88
2.5.
AIDSK
2.6.
RUSLE 2015
2.7.
Century model
2.8.
Standard Cost Model
2.9.
Workshops with experts
2.10.
Intervention logic based on expert judgement
2.11.
Multi-criteria-analysis
3.
Description of tools used in the different phases
3.1.
Evaluation of baseline
3.2.
Assessing the impact of options
3.3.
Addressing uncertainties
3.4.
Comparing the baseline and the options
Annex 5.3: Objectives used in the MCA
Annex 5.4 – Non-productive elements in the EU
Annex 5.5: Capping
Annex 5.6: Share of direct payments received by biggest beneficiaries and biggest farms
Annex 5.7 – Income variability
Annex 6: Promoting Modernisation
1.
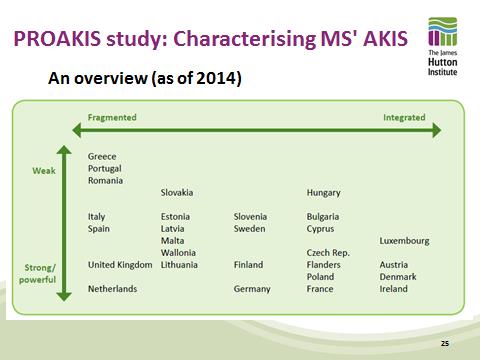
Enhancing Agricultural Knowledge and Innovation Systems (AKIS) and strengthening links with research
2.
Strengthening of farm advisory services within the Agricultural Knowledge and Innovation Systems
3.
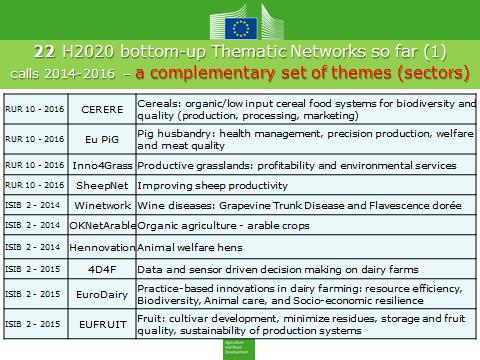
Enhancing interactive innovation
4.
Supporting digital transition in agriculture
Annex 7: Simplifying the CAP
120
1.
Administrative burden under the CAP
121
2.
CAP simplification and modernisation: changes considered for post-2020
125
2.1.
The new delivery model
125
2.2.
Changes under the Common Market Organisation
126
3.
A CAP oriented towards performance
129
4.
Scope for reducing administrative burden
129
4.1.
Simplification under the new delivery model
129
4.2.
Strategic design and delivery for administrative burden reduction
132
4.3.
Assessing administrative burden reduction
135
5.
Towards efficient CAP design and delivery
140
Annex 8 - Behavioural evidence from focus groups with European farmers on approaches to encourage more environmental-friendly practices
141
Annex 9 – Bibliography
148
Annex 10 – Glossary
163
Annex 5: Results of quantitative and Multi Criteria Analysis
Acknowledgments
DG AGRI would like to thank colleagues in JRC for the support and close collaboration on the modelling of the impacts (JRC Seville) and the environmental aspects (JRC Ispra). Also for the qualitative assessment on environmental aspects, JRC Ispra was involved.
Glossary
|
Term or acronym
|
Meaning or definition
|
|
AECH
|
Agro Environment, Climate and Health measures
|
|
AKIS
|
Agricultural Knowledge and Innovation Systems
|
|
AMR
|
Antimicrobial Resistance
|
|
ANC
|
Areas facing Natural Constraints
|
|
AWU
|
Annual Work Unit
|
|
BAS
|
Baseline
|
|
BP
|
Basic Payment
|
|
BPS
|
Basic Payment Scheme
|
|
CAP
|
Common Agricultural Policy
|
|
CATS
|
Clearance Audit Trail System
|
|
CO2
|
Carbon dioxide
|
|
COP
|
Cereal, Oilseed and Protein crops
|
|
DG
|
Directorate-General
|
|
DP
|
Direct Payments
|
|
EBA
|
Everything but arms
|
|
ECO
|
Economic Challenges Working Group
|
|
EEA
|
European Environment Agency
|
|
EIP
|
European Innovation Partnership
|
|
ELS
|
Entry-Level Scheme
|
|
ENV
|
Environmental and Climate Challenges Working Group
|
|
ES
|
Economic Size
|
|
FADN
|
Farm Accountancy Data Network
|
|
FAS
|
Farm Advisory System
|
|
FNVA
|
Farm net value added
|
|
GAEC
|
Good Agricultural and Environmental Conditions
|
|
GGE
|
Greenhouse Gas Emission
|
|
GHG
|
Greenhouse Gas
|
|
GI
|
Geographical Indication
|
|
GNB
|
Gross-Nitrogen Balance
|
|
H2020
|
Horizon 2020
|
|
ha
|
hectare
|
|
IA
|
Impact Assessment
|
|
IPM
|
Integrated Pest Management
|
|
IST
|
Income Stabilisation Tool
|
|
JRC
|
Joint Research Centre
|
|
kg
|
kilogramme
|
|
km
|
kilometre
|
|
LDC
|
Least Developed Countries
|
|
LFA
|
Less Favoured Areas
|
|
MCA
|
Multi Criteria Analysis
|
|
MO
|
Main (Policy) Objective
|
|
MS
|
Member States
|
|
N
|
Nitrogen
|
|
NMP
|
Nutrient Management Plans/Tools
|
|
NUTS
|
Nomenclature of Territorial Units for Statistics
|
|
Mt
|
Million tonnes
|
|
OO
|
Operational Objective
|
|
PCD
|
Policy Coherence for Development
|
|
PO
|
Producer Organisation
|
|
pp
|
percentage point
|
|
RD
|
Rural Development
|
|
RM
|
Risk Management
|
|
SAPS
|
Single Area Payment Scheme
|
|
SDG
|
Sustainable Development Goals
|
|
SME
|
Small and medium-sized enterprise
|
|
SO
|
Specific Objective
|
|
SOC
|
Socio-economic Challenges Working Group
|
|
SPS
|
Single Payment Scheme
|
|
T
|
Tonne
|
|
TAMS
|
Total Aggregate Measurement of Support
|
|
UAA
|
Utilised agricultural area
|
|
VA
|
Value Added
|
|
VCS
|
Voluntary Coupled Support
|
|
YF
|
Young Farmer
|
|
Yr
|
Year
|
1.Introduction
This annex first summarizes the quantitative results of the option comparison. The second part merges these results with qualitative results from a group expert judgement in a Multi Criteria Analysis (MCA). In annex a detailed description of the options (annex 5.1), the analytical tools and methods used (annex 5.2) and the objectives (annex 5.3) can be found. Annex 5.2 also details how the MCA was organized and which experts participated in the process. The qualitative assessment was organized to complement the modelling exercise as the applied models are not capable of capturing all effects of the tested instruments. Especially on the social (and to a lesser extend the environmental) dimension of the policy, expert judgement offers an important contribution to the analysis. The qualitative assessment also allows unveiling the reasons behind differences in option scores.
On some occasions the modelling and expert judgement diverge, which can be linked on the one hand to the fact that the models cannot capture all intended policy effects and on the other hand the under- (or over-) estimation of some effects by the experts. For these reasons it is fruitful to combine both approaches. Where appropriate, these differences are highlighted and discussed.
The following two tables highlight the assumptions for key CAP interventions.
Note: Baseline with the post-Brexit budget cut is referred to as Option 1 in Annex 5.
Table 1.1 Income support and redistribution in the options
|
|
Option 1
|
Option 3a
|
Option3b
|
Option 4***
|
Option 5
|
|
Decoupled payments*
|
High
|
Very small
MS flat rate
|
Medium
|
Strong
flat rate by land type
|
Medium
degressive with size
|
|
Voluntary coupled support
|
High
|
0
|
High
targeted to EU goals and improving competitiveness
|
Small
targeted to extensive livestock
|
Potentially high targeted to EU goals
|
|
Areas with natural constraints
|
Lower further to Brexit
|
Maintained
in pillar II
|
Maintained in pillar II (higher national funds)
|
Maintained in pillar II (higher national funds)
|
Increased
top up in pillar I
|
|
Payment redistribution
|
Top up to first ha in 8 MS.
Degressivity in 14 MS from 150 000 EUR, % cut vary by MS from 5 to 50%**
|
0
|
To small-medium farms via a top up to first 30 ha
|
To farmers with lower income
via an increase in support to permanent grassland
|
To small-medium farms
via the modulation of support by size
|
|
Capping per farm (with salaries correction)
|
Limited,
in 8 MS
threshold from 150 000 to 500 000 EUR
|
100 000 EUR
|
100 000 EUR
|
100 000 EUR
|
60 000 EUR
|
|
Capping per ha
|
|
|
1 000 EUR
|
|
|
|
Minimum requirements
|
Threshold in EUR or ha varies from 0.5 to 4 ha and from 100 to 500 EUR
|
2 ha
|
2 ha
|
2% of ag. income (varies by MS, from 100 to 1 000 EUR)
|
Status quo
|
* includes the basic payment scheme, the single area payment scheme and greening
** e.g. amounts above 150 000 EUR per farm (with salaries correction) are cut by 5% in BG and by 50% in IT.
*** options 4a and 4b are similar in terms of direct payments implementation.
Table 1.2 The green architecture in the options
|
|
Option 1
|
Option 3a
|
Option3b
|
Option 4a
|
Option 4b
|
Option 5
|
|
Conditionality
|
+
|
++
|
++
|
++++
|
++
|
++
|
|
Other interventions
|
|
|
|
Support redistribution to permanent grassland and targeted coupled support to extensive livestock
|
Targeted coupled support to extensive livestock
|
|
Eco-scheme (voluntary)
|
|
++
|
+
|
|
|
|
|
Top ups
|
|
|
|
|
|
++
|
|
AECH
|
+
|
+
|
+
|
+
|
+
|
++
|
2.Results of quantitative analysis
The findings are presented according to the corresponding objectives
2.1.Support viable farm income and resilience across the EU territory
2.1.1.Provide income support in a targeted way
Negative impact of policy changes on average EU income level
Farm income is negatively affected in all options compared to baseline and option 1 for three main reasons:
1.The budget cut and redistribution of support (notably to small and medium size farms).
2.The reduction in direct payments because of re-allocation of funds to risk management (options 3 and 4): this leads to a decrease of the EU average income level in 'normal
' years assessed here. In years of strong yield or price drops, risk management tools can help farmers to mitigate negative impacts on income.
3.The changes in farm practises to increase the environmental and climatic performance of the CAP: the land re-allocation to fulfil crop rotation restriction, the costs to comply with the other green requirements and the obligation to dedicate more land to non-productive elements lead to a significant decline in cereal area in favour of set aside and fallow land, and thus a decline in market revenue.
Note of caution: farm income decline is overestimated, as the model used does not account for structural change, price feedback
and longer term benefits due to changes in production systems. Nonetheless, the analysis gives an accurate indication of the relative performance of the various options in the short-term, as well as of the expected impact on different farm types and sectors.
This modelling exercise does not account for structural change, i.e. it assumes the same number and size of farms in all simulations. However, large income decreases such as those expected for certain sectors/options might push less efficient farmers out of business.
The largest income
drop is in option 3a (-10% relative to option 1), where the switch of priority to risk management is the strongest and then in option 4a (-8%), the two options with the highest environmental ambition. The income decline is smaller and of a similar range in option 3b, 4b and 5 (around -5% compared to option 1). A linear cut (option 1) would drive a smaller drop on average (-2%) but without addressing the challenges ahead and certain sectors and MS would be more strongly hit.
In option 3, the uptake of the voluntary eco-scheme is simulated at EU level at 98%, varying from less than 90% in Portugal to 100% in MS with large areas of permanent grassland. It means that in view of the eco-scheme adoption costs and the unit payment level simulated here, only a small number of farmers chose to opt out from the eco-scheme. It shows that the unit payment level, which was set assuming a 100% uptake, is a significant incentive for farmers to adopt the changes in practises, all the more because of the importance of support in farmers’ income. It highlights also the difficulty that MS will face in maximising environmental-climatic-health benefits and budget allocation at the same time on an annual basis. Said differently, it highlights the difficulty to predict in advance the level of uptake and the most appropriate aid level in view of the requirements.
Table 2.1 Impact of policy options on EU average farm income
|
|
Relative to baseline
|
Relative to option 1 (baseline with cuts)
|
|
|
1
|
3a
|
3b
|
4a
|
4b
|
5
|
|
Direct payments
|
-10%
|
-75%
|
-40%
|
-6%
|
-6%
|
-26%
|
|
Total support
|
-10%
|
-11%
|
-7%
|
-4%
|
-4%
|
-6%
|
|
Income
|
-2%
|
-10%
|
-5%
|
-8%
|
-5%
|
-5%
|
Source: JRC, IFM-CAP
The impact of policy options varies strongly by type of farming
Cattle and sheep producers are strongly affected in options where support is significantly cut (option 1 and 3) and where coupled support is removed (option 3a). In option 1, the income of cattle producers is reduced by around 10%, an additional 25% cut compared to option 1 occurs in option 3a (Graph 2.2), where the number of cattle heads declines by 3% relative to option 1. The drop in income of sheep producers reaches 4% on average in option 1 and an additional 6% drop is implied in option 3a.
The drop in income is attenuated when these sectors benefit from re-allocation of support for their contribution to environmental sustainability via coupled support (options 3b, 4 and 5). The redistribution of support to permanent grassland (options 4 and 5) also contributes positively to the income of these farmers. In option 5, the redistribution of direct payments to smaller farms benefits to sheep farmers but affects negatively the income of cattle producers (on average 50% larger than the EU average professional farm). However, thanks to the redistribution of support to permanent grassland and to the coupled support to extensive livestock the fall in income is less drastic.
|
Graph 2.1 Impact of a 10% linear cut in support relative to baseline on EU income by type of farming
|
Graph 2.2 Impact of a shift in priorities applying on top of a support cut on EU income by type of farming
|
|
Source: JRC, IFM-CAP
|
Source: JRC, IFM-CAP, changes relative to option 1
|
For milk producers, the average impact is relatively lower; though it hides significant differences between production systems. Very extensive systems grass-fed have high income drops in options 3a and 5 and the reduction in income of most intensive farmers varies between 8% in option 3b and 14% in option 5. The income effects assessed in this analysis for pigmeat and poultry producers derive mainly from the changes in support and practises for arable land. 70% of pigs and 45% of poultry are produced on farms with more than 10 ha.
The income of olive producers, largely depending on direct payments and often granted higher per hectare payments, drops significantly in all options, except in option 5 because olive growers are on average 65% smaller than the average EU farm. Changes in income of wine and fruits (orchards) producers are smaller, because, first, the share of direct payments in income is lower and, second, the simulated changes in farm practises related to permanent crops are less constraining (i.e. the adoption costs of permanent cover crop is relatively low compared to income.
The reduction and redistribution of direct payments, as well as the higher requirements to increase environmental benefits affect COP (cereal, oilseed and protein crop) producers in all options in 'normal' years. The negative impact on producers of other field crops is amplified by the crop rotation obligation and by the removal of coupled support to sugar beet in almost all options.
The cut in direct support (options 1 and 3) has a strong effect on crop producers because direct payments represent a large share of their income, 10% lower direct payments imply an income drop by 6% for specialised COP producers. In addition, in all options (except option 3b), direct payments are regionalised. It implies that in MS where the per hectare direct payment level still varies between farmers (mainly in relation to historic references), the income of COP farmers which traditionally received higher per ha payments is negatively affected by the introduction of flat rates (whether at MS level or by land type). In option 4, the redistribution of support to permanent grassland (with the unitary level increased by 20%) implies little changes in per hectare payment for arable crops in MS with arable area significantly larger than grassland in DK, while in DE and FR it leads to a drop by more than 5% and in the Netherlands by 20%.
Significant changes in land allocation to be expected
Conditionality requirements have a significant impact on crop producers notably in MS with a lower share of fallow land (12 MS have less than 2% of UAA with fallow land, see Annex 5.4). On average in the EU, in option 4b and 5 where only minimum requirements (3% of UAA with non-productive elements) apply, the share of fallow land and set aside in UAA increases by around 1 percentage point (pp) and by more than 2 pp in option 3a and 4a, where MS implement more ambitious green requirements. However, this effect is overestimated because of the lack of knowledge on landscape elements. To limit this overestimation, the requirement was modelled as the obligation to keep non-productive elements on 3% of the arable and permanent crop area (assuming that more linear elements are present on permanent grassland). This is one of the explanatory factors of the significant increase in permanent grassland simulated by the model (up to +4.5% in option 3a and 4a). Though overestimated, it shows that increased requirements could be an incentive for farmers not to plough temporary grassland.
The crop rotation obligation implies a switch from more remunerative activities such as horticulture and others field crops to less remunerative activities such as soft wheat, oilseeds and set aside. The difference in income drop between option 4a and option 4b can be directly interpreted as the effect of enhanced conditionality (modelled here as winter soil cover with catch crops, 3 year rotation and the obligation to have 2% more of UAA with non-productive elements). The simulated income drop is above 15% for potato and sugar beet producers and close to 10% for COP producers. The crop rotation obligation leads more particularly to a decline in grain maize, durum wheat, sugar beet and potato areas. In this simulation, the income drop is also high for horticulture because in the model farmers producing only vegetables in open field can rotate only between tomatoes and other vegetables, while in reality the diversity of vegetables at hand of farmers is wider. The 2-year rotation does not lead to a decline in soft wheat area; on the contrary it increases in option 3b (+2% relative to option 1). For soft wheat, the 3-year rotation might play a role but a stronger factor is the drop in support; it can be seen in option 5 where the redistribution of direct payments to smaller farms (while COP producers are on average more than twice larger than the average EU farm) and to other production systems (organic, permanent grassland, hedges and areas with natural constraints - ANCs) leads to a 5% wheat area decline and contributes strongly to the 14% drop in income of COP producers relative to option 1.
The fact that COP farms tend to be larger explains also why farms subject to capping of support are mainly specialised in crop production.
The increase in oilseeds area derives mainly from the 3-year rotation obligation (options 3a and 4a), while the decline in protein crops derives from the removal of coupled support (option 3a, 4a and 4b) as well as the fact that nitrogen-fixing crops do not qualify either to fulfil conditionality requirements nor for the ecological focus area requirements set by MS with high green ambition (option 3a and 4a). The top-up simulated in option 5 (80 EUR/ha) implies an increase of pulses area by 44% relative to option 1, which is quite significant even though protein area is still small in the EU. It shows the positive effect on production of coupled payments for this crop with lower economic profitability.
Table 2.2 Changes in land allocation due to changes in support and green requirements (%)
|
|
Cereals
|
Oilseeds
|
Protein crops
|
Sugar beet
|
Potato
|
Set aside and fallow land
|
Permanent grassland
|
|
Relative to baseline
|
|
1
|
0.1%
|
-0.1%
|
0.3%
|
-0.6%
|
0.0%
|
0.1%
|
0.0%
|
|
Relative to option 1
|
|
3a
|
-6%
|
5%
|
-23%
|
-23%
|
-10%
|
37%
|
4.5%
|
|
3b
|
-2%
|
1%
|
-12%
|
-8%
|
-2%
|
10%
|
3.7%
|
|
4a
|
-7%
|
6%
|
-9%
|
-23%
|
-10%
|
34%
|
4.5%
|
|
4b
|
-3%
|
-2%
|
-17%
|
-12%
|
-2%
|
19%
|
3.7%
|
|
5
|
-7%
|
6%
|
44%
|
-13%
|
-3%
|
15%
|
3.7%
|
Source: JRC, IFM-CAP, % changes based on FADN data covering 90% of EU land.
Table 2.3 Changes in land allocation applied to the 2030 EU agricultural outlook (1 000 ha)
|
|
Cereals
|
Oilseeds
|
Pulses
|
Sugar beet
|
Potato
|
Set aside and fallow land
|
Permanent grassland
|
|
1
|
100
|
0
|
0
|
0
|
0
|
0
|
0
|
|
3a
|
-3 400
|
600
|
-300
|
-400
|
-100
|
2 000
|
3 400
|
|
3b
|
-1 100
|
100
|
-200
|
-100
|
0
|
600
|
2 800
|
|
4a
|
-4 000
|
700
|
-100
|
-400
|
-100
|
1 900
|
3 400
|
|
4b
|
-1 700
|
-200
|
-300
|
-200
|
0
|
1 000
|
2 800
|
|
5
|
-4 000
|
700
|
700
|
-200
|
0
|
800
|
2 800
|
Source: DG AGRI
The changes in land allocation resulting from the other model used in this analysis (CAPRI) are smaller, especially for cereals, but indicate broadly the same trends. In addition, in CAPRI contrary to IFM-CAP, land abandonment is accounted for. All options result in a small reduction in UAA: 300 000 ha because of the budget cut and on top around 500 000 ha less in option 4a (-0.3% compared to option 1) and 400 000 ha in option 3a where more requirements apply. The decline is smaller in options 3b and 4b (260 000 ha and 200 000 ha respectively), while in option 5, the UAA remains almost stable compared to option 1. In IFM-CAP, the UAA is assumed to be fixed in all scenarios.
The targeting of direct payments is significantly improved in options 4 and 5
The options test various ways of targeting direct payments and CAP support:
·to smaller and medium size farms via a payment level modulated by size (option 5), a redistributive payment (option 3b) and a capping system which all allow accounting for the economies of scale in larger farms.
·to farmers most in need via the support to areas with natural constraints, coupled support to extensive livestock, the redistribution of support to permanent grassland (allowing indirectly to target farmers with lower income in option 5).
·to incentivise farm practices more beneficial to the environment, climate and health, via conditionality, the eco-scheme and environmental top ups.
Targeting support to small and medium size farms
Note: This assessment was carried out with the IFM-CAP model, based on FADN representing commercial farms. These farms are on average larger than the whole farm population. In FADN, EU farms have on average 30 ha, accounting for all farms, the average farm size drops to 16 ha (farm structure survey 2013).
The modulation of the basic decoupled payment by size is an efficient way to redistribute support from larger to smaller and medium size farms in physical and economic terms currently receiving less support (option 5) and can almost fully offset the effect of budget cuts on farms with between 5 and 30 ha. However, the modulation simulated here implies a close to 30% reduction in support to farms with more than 500 ha and an income drop above 10%, while these farms employ more people (20 AWU on average, 13 times more than the EU average). The redistributive payment simulated in option 3b (80 EUR/ha from 2 to 30 ha) allows also a shift of support to smaller farms, with lower income drops for larger farms though.
Importantly, the increase in minimum requirements to be eligible to decoupled payments leads to a lower support granted to farms with less than 5 ha in option 3 and 4 (see also chapter 2.1.3). This percentage is particularly high (between -25% and -33%) because the support granted to these farms in absolute value is small (around 1 000 EUR/farm in option 1). In addition, farms below 5 ha can have a large economic size and higher income than average (wine, horticulture). Therefore, in terms of economic size, the change in support for smallest farms is lower (-15% in option 3a to -6% in option 4).
|
Graph 2.3 Change in support relative to option 1 by area size class (ha)
|
Graph 2.4 Change in support relative to option 1 by economic size class (1 000 EUR)
|
|
Source: JRC, IFM-CAP
|
Source: JRC, IFM-CAP
|
Note: direct payments include the basic decoupled payment, the redistributive payment and coupled support. Total support includes the eco-scheme, the environmental top ups, the ANC payment and the agri-environment-climate measures.
The redistribution simulated in option 4 implies higher support to farms above 150 ha, because of the increased support to permanent grassland. However, this regionalisation by land type is efficient in shifting direct payments from more intensive farms to more extensive ones (
Graph 2.6
). In option 5, the higher direct payments granted to first hectares imply a relatively lower decline in basic payment to most intensive farms (smaller on average) and a decline to most extensive ones. The latter effect is compensated with coupled support to extensive livestock and top ups to permanent grassland.
Targeting support to farmers most in need (with lower income)
The current policy is granting higher support to farms with higher income but also to the 10% farms with the lowest income (
Graph 2.5
): the latter receive 8 000 EUR/AWU, the 50% farms with the highest income receives around 12 000 EUR/AWU relative to between 2 000 and 6 000 EUR/AWU for the other farmers.
None of the options perform better than the baseline, because redistributive effects do not offset cuts and some support is re-allocated to risk management. Option 5 (decoupled payment modulation by size, coupled support for extensive livestock and top-up to permanent grassland and ANC) performs as well as option 1 to redistribute support from farms with higher income per AWU to those with lower income level. Option 4 (regionalisation by land type and redistribution to permanent grassland) performs slightly less. Provided farmers will largely adopt the voluntary eco-scheme to catch the premium, option 3b (redistributive payment) would perform as well as option 4. In any case, mainly because of the reallocation of support to risk management option 3a performs the least.
|
Graph 2.5 Support per AWU by class of income (Q1 = lower to Q10 = higher income)
|
Graph 2.6 Change in support relative to option 1 by class of production intensity
(Q1 = more extensive to Q10 = more intensive income)
|
|
Source: JRC, IFM-CAP
|
Source: JRC, IFM-CAP
|
In option 3a this shift in priorities affects negatively almost equally farmers of all economic classes. Option 3b with the redistributive payment allows maintaining the income of medium economic size farms (from 8 to 100 000 EUR) while support drops is higher for larger farms. In addition, would the uptake of eco-scheme be lower, support drops could be larger.
It is a well-known phenomenon that some years the farm net value added of farms is negative (market revenue + subsidies – total costs – depreciation), it does not mean that the cash flow is negative but that accounting for the loss of capital value the farm income is negative. If this situation lasts for several years it is threatening strongly the viability of the farm.
Table 2.4 Share of farms with negative income
|
Baseline
|
1
|
3a
|
3b
|
4a
|
4b
|
5
|
|
14%
|
15%
|
17%
|
15%
|
16%
|
15%
|
15%
|
Source: JRC, IFM-CAP
In the baseline, the share of farms with a negative farm net value added reaches 14%, this share increases to 15% in option 1 with the budget cut. In option 3a, with the shift of priority to risk management tools and the increased environmental-climatic ambition this percentage increases to 17%. In option 4b, the loss in revenue due to the same environment-climate ambition leads to 16% of farms with negative income. In the other options (3b, 4b and 5), the share is the same as in option 1.
It is important to note once more that structural change is not accounted here. But in a situation of income deterioration an increase of the number of farmers leaving the agricultural business might be expected. In addition, in this modelling exercise only intermediate costs vary with the changes in farming practices but fixed costs (labour, machinery, energy…) remain constant, while some adaptation might take place too.
A fairer distribution of support
Capping the level of DP farmers can be granted is seen as one way to reach a fairer distribution of support. In this simulation, two levels of capping per farm were tested: 100 000 EUR (options 3 and 4) and 60 000 EUR (option 5). In this impact assessment, only the capping of the basic payment and the redistributive payment were simulated. Elements changing across options (the eco-scheme, the environmental top-ups and the coupled support implemented to address EU concerns and sectors in difficulty) were not part of capping, to facilitate comparison across options.
Currently, only 8 MS apply a capping from a threshold of 150 000 EUR to 500 000 EUR. In addition, direct payments are cut (by 5% to 50%) from 150 000 EUR per farm in 14 MS. It raises a capping product of 120 million EUR, coming mainly from HU, PL and BG. The capped farms have close to 50 employees on average (see Annex 5.5). It means that the current capping penalises farms providing numerous jobs. Despite the possibility to apply a correction for salaries HU, PL, SK and CZ do not apply it, because it is deemed too complicated. Lowering the capping threshold to 100 000 EUR or even 60 000 EUR could convince these MS to apply this correction, even to possibly consider family labour. It could also be looked at a simpler solution to deduct salaries, possibly based on MS average wage. In addition, with a capping level at 60 000 EUR the possibility to deduct opportunity costs for family labour could as well be considered.
Applying a capping of 100 000 EUR (with salaries correction) to the current basic decoupled payments (BPS/SAPS and greening) ceteris paribus would raise a capping product of 350 million EUR. Applied to all direct payments the capping amount could reach 920 million EUR. However, the budget cut and the shift in priorities could lead to much lower capping products: 0 EUR in option 3a (where the basic payment represents only 25% of pillar I envelope), 10 million EUR in option 3b, 50 million EUR in option 5 (despite a capping at 60 000 EUR).
In addition, in all capping scenarios, BG and RO are the 2 MS where most of the direct payments are capped, despite the correction of salaries. In HU, CZ and SK the salaries correction implies a strong drop in capped amounts. Would capped amounts be cut from MS envelopes it would raise a serious issue of cohesion, knowing that these two MS grant among the lowest support per ha and belong to the poorest MS of the EU.
This is why, in option 4, the capping is used as an actual tool of redistribution. Meaning that instead of cutting the envelope (by potentially more than 300 million EUR, out of which more than 60% in BG and RO), the budget is redistributed to smaller farmers by increasing the per hectare payment (by around 10% in BG and 6% in RO). It is not a simple budgetary mechanism but it addresses citizen concerns without damaging cohesion.
In the option where the link to historic payment levels is kept (option 3b), on top of the capping per farm, a capping per ha was introduced (1 000 EUR/ha of basic payment and redistributive payment in this simulation). The number of farmers affected is relatively low compared to how many farmers would have been affected if that capping would have applied in 2015. The main reasons are: the increasing convergence of direct payments per ha to take place in the coming years and accounted for in the baseline, the reduction of direct payments simulated in option 3b and the potential lack of representativeness of these farms in FADN. An assessment carried out on the 2015 payments (CATS database) showed that a capping per ha of the basic payment scheme, the single area payment scheme and the greening at 1 000 EUR/ha would have led to cut direct payments to more than 200 000 beneficiaries and to a capped amount of 1.5 billion EUR. The farms capped are mainly located in EL, IT and ES. They have an average of 4 hectares and received around 7 400 EUR per farm in 2015. Most of these farmers are olive growers but there are also some intensive livestock producers (cattle and sheep). With a capping at 600 EUR/ha, the number of beneficiaries capped would have raised to 600 000 and PT would be hit too. A capping level relative to the average direct payment per MS was tested too and revealed more proportionate.
Table 2.5 Capped amounts by option
|
|
Baseline
|
Baseline+capping
|
3a
|
3b
|
4
|
5
|
|
Level of capping
|
various
|
100 000
|
100 000
|
100 000
|
100 000
|
100 000
|
60 000
|
|
Scope
|
BPS/SAPS
|
BPS/SAPS + greening
|
all DP
|
BP
|
BP and redistributive payment
|
BP
|
BP
|
|
Product of capping (MEUR)
|
120
|
350
|
920
|
0
|
10
|
0
|
50
|
Source: JRC, IFM-CAP
Capping is not the most efficient way to reduce the concentration of direct payments, when the funding no longer paid to large farms is removed from the direct payments budget altogether instead of being redistributed to smaller farms. Modulation of direct payments by size is more effective to reduce the share of direct payments received by the 20% biggest CAP beneficiaries as illustrated in the graphic below. In option 5, these beneficiaries capture 67% of direct payments, relative to 73% in the baseline
. This reduction might seem small in view of the huge redistribution to small and medium farms operated in option 5, however it highlights that support concentration derives from land distribution in the EU. Option 3b, allows for a drop in concentration of 2 pp only thanks to the redistributive payment. By contrast, options 3a and 4 imply a small increase in concentration of DP.
However, some of the large beneficiaries employ a lot of people, looking at the concentration of direct payments not by beneficiary but by worker, the level of concentration reduces to 66% for the 20% of farm labour employed on farms with largest direct payments per AWU in the baseline. In option 5, this concentration is 3 pp below.
Graph 2.7 Share of direct payments received by 20% farms
Source: JRC, IFM-CAP
Another measurement of support concentration is the Gini coefficient, varying between 0 and 1: the closer to 0 the lower the concentration. In the EU, the Gini coefficient of land concentration (again measured using the FADN sample) is 0.58, not surprisingly very close but slightly below the concentration of support in the baseline at 0.57. As concluded based on the measurement of the share of direct payments granted to 20% of biggest beneficiaries, option 5 allows for a reduction in support concentration (Gini coefficient of 0.55), while the concentration increases slightly in option 3b and 4 and more significantly in option 3a (0.61) due to the flat rate payments. In terms of income, the budget cut leads to a higher concentration of income (option 1, 0.735) relative to baseline (0.729). None of the tested options allows correcting this; on the contrary, as for support, options 4a and 3a imply a higher concentration of income in the hand of more efficient farmers in terms of income generation. The difference in Gini coefficient between option 4a and 4b shows the effect of the higher environmental-climatic ambition simulated here: the losses in market revenue implied by changes in farm practices slightly increases income concentration.
Table 2.6 Concentration of land, direct payments and income measured with a Gini coefficient
|
|
UAA
|
Direct payments
|
Income
|
|
Baseline
|
0.579
|
0.570
|
0.729
|
|
1
|
|
0.570
|
0.735
|
|
3a
|
|
0.609
|
0.750
|
|
3b
|
|
0.575
|
0.739
|
|
4a
|
|
0.581
|
0.745
|
|
4b
|
|
0.581
|
0.738
|
|
5
|
|
0.552
|
0.739
|
Source: JRC, IFM-CAP, based on professional farms (FADN data)
2.1.2.Reduce inequalities between territories by supporting farms across the whole territory
Historically, direct payments granted to areas with natural constraints were lower and this gap was compensated by a specific aid to ANCs, programmed in rural development. The area in ANCs represents around 50% of EU area and 30% of the eligible area. In the baseline, farms in mountain areas are granted around 6 500 EUR of direct payments per farm while outside ANCs farms are granted around 8 400 EUR. Accounting for ANC support but also agri-environmental payments the average support increases to more than 10 000 EUR granted in mountain areas and around 9 000 EUR outside ANCs.
The share of pillar II envelope dedicated to ANCs is 17% in the current programming period. In all options, support to ANCs is maintained given the importance to keep farms on the whole EU territory to support employment in rural areas and also for the environmental benefits associated with farming activity. However, some MS dedicate a very large share of their rural development envelope, (especially France 37%, Ireland and Finland 32% and 29% in Luxembourg ), meaning that in a context of reduced EU budget and of gaining importance of other priorities, to continue supporting farms in ANCs at the same level, MS might need to use additional national funds (as simulated here in option 3b for all MS and in option 4 where a maximum of 25% of pillar II envelope for ANC is tested implying a reduction in EU funds for ANCs in FR, IE, LU, CZ, SK, SI and SE).
In option 1, the budget cut implies a 10% reduction in support in ANCs. In option 3, provided ANC payments are maintained, total support in ANCs could remain equivalent to option 1, but support in less favoured areas not mountain would decrease further.
By contrast, option 4 by redistributing support to permanent grassland re-directs support to mountain areas but the most efficient way to support mountain areas is a specific top up granted in pillar I to ANC as in option 5 (provided farmers could keep the same level of aid in MS granting large national support to ANCs). However, in both options ANCs not located in mountain areas do not benefit from reallocation of support.
|
Graph 2.8 Change in support relative to option 1 by ANC zone
|
Graph 2.9 Income per AWU by ANC zone
|
|
Source: JRC, IFM-CAP
|
Source: JRC, IFM-CAP
|
2.1.3.Simplify increasing thresholds to receive decoupled payments
In order to reduce the number of beneficiaries of very small amounts of aid, deemed not contributing significantly to farmers’ income, thresholds apply currently. MS fix them in euros (varying from 100 to 500 EUR) and/or in hectares (varying from 0.5 to 5 ha). In this analysis, the introduction of a 2 hectares threshold is tested (option 3). This option would exclude from the direct payment system more farmers than the current system (options 1 and 5) and then a system based on thresholds in EUR accounting for the differences in standard of living (option 4).
An analysis based on the 2016 CAP beneficiaries shows that a 2 hectares threshold would have reduced the number of beneficiaries by than 1.5 million (24%) for a reduction in hectares paid by 1.3% only, 3% of the amount of basic payment, single area payment and small farmer scheme granted and 2% of total direct payments paid. These beneficiaries were granted on average 420 EUR in 2016. This amount varies between 85 EUR in LT to close to 3 300 EUR in NL (where the flat rate will apply from 2019 only).
A threshold at 2 ha might be too high in MT and CY where around 70% of beneficiaries fall under the threshold and are granted more than 40% of basic decoupled payments in MT and around 15% in CY. Similarly, large share of payments were granted to beneficiaries with less than 2 ha in 2016 in EL (15%), RO (10%), IT and PT (7%). However, this threshold could represent a real simplification in MS such as BG, SK, HU and LT where more than 15% of beneficiaries are granted less than 1% of the payments. A question remains about the importance of the aid contribution (around 80 EUR in LT, 200 in BG and in SK, 400 in HU) to these farmers’ income.
Option 4 is testing a threshold in EUR, above the current thresholds applied, and corresponding to the equivalent of 2% of agricultural income. It means that to receive basic decoupled payments, farmers need to be eligible to a minimum of basic decoupled payment varying between 100 EUR (in RO, BG, PL, HR, SI) and 1 000 EUR in DK. Applied in 2016, such a system would have reduced the number of beneficiaries by 10% (0.6 million) and the amount of aid paid by 0.7% only and an average amount of 240 EUR granted per beneficiary. With a threshold at 200 EUR more than 60% of Maltese farmers would fall out of the direct payment system for a 33% share of basic decoupled payments. In the other MS, the share of payments granted to beneficiaries below the thresholds is smaller: 5% in CY, 4% in LT and 3% in IT.
A threshold in euros, can avoid excluding from the system potential beneficiaries of amounts of aid important for the living of farmers. However, a threshold in hectares is much simpler to manage than a threshold in euros, for which the calculation of payments needs to be done before beneficiaries can be excluded. MS could explore further the most adequate threshold level. In addition, in context of reduced direct payments the amounts of aid granted to beneficiaries below 2 ha would be smaller.
Table 2.7 Beneficiaries below tested thresholds in 2016
|
million
|
Beneficiaries
|
Area paid
|
Amount paid
|
|
Total in 2016
|
6.5
|
154
|
23 069
|
|
of which below 2 ha
|
1.5
|
1.9
|
640
|
|
|
24%
|
1.3%
|
2.8%
|
|
of which below 2% of ag. Income
|
0.6
|
1.2
|
152
|
|
|
10%
|
0.8%
|
0.7%
|
Source: DG AGRI, CATS, based on BPS, SAPS and SFS
To assess better who are the beneficiaries potentially excluded from direct payments with various thresholds, the analysis was run with the IFM-CAP model. Given it is based on FADN surveying only professional farms, the number of beneficiaries below thresholds is smaller.
In the baseline, farmers below threshold are many involved in wine production and horticulture, they are located at more than 30% in ES and also in RO, IT and FR. Some of them have a very large economic size (12% with more than 100 000 EUR of size). Would these farms have been granted direct payments their income would have increased by less than 1% for most types of farming.
As shown based on the 2016 payments, option 3 leads to a higher number of farmers excluded from the direct payments system. The reduction by half of the number of farmers below thresholds in option 5 compared to baseline, highlights the impact of the reduction in direct payments and at the same time the increased payments to smaller farms. This is why the number (and share) of farms below threshold from the lower economic class increases in this option.
In option 3, farms below thresholds are mainly mixed farms, located in RO and IT and of the smallest economic size. In option 4, the distribution of farms below thresholds by type is close to the baseline situation, with a higher share of sheep and dairy farms and RO though. In option 4, the number of farms below thresholds is lower than in option 3 but the impact on farms income is slightly higher, though rather low (estimated at 1% against 0.7% in option 3b). These thresholds would weigh more cattle producers with low income in option 4 and on olive producers in options 3 and 4.
Table 2.8 Identification of professional farms below thresholds
|
|
Baseline
|
Option 3
|
Option 4
|
Option 5
|
|
Total number of farms
|
285 800
|
506 000
|
322 100
|
134 000
|
|
Change/baseline
|
|
77%
|
13%
|
-53%
|
|
Share by specialisation
|
100%
|
100%
|
100%
|
100%
|
|
Horticulture
|
25%
|
19%
|
22%
|
29%
|
|
Wine
|
21%
|
12%
|
15%
|
16%
|
|
Mixed
|
19%
|
27%
|
24%
|
26%
|
|
Orchards
|
15%
|
10%
|
10%
|
7%
|
|
Sheep&Goat
|
4%
|
9%
|
8%
|
6%
|
|
Milk
|
2%
|
8%
|
7%
|
4%
|
|
Other
|
14%
|
16%
|
14%
|
13%
|
|
Share by MS
|
100%
|
100%
|
100%
|
100%
|
|
ES
|
34%
|
6%
|
12%
|
14%
|
|
RO
|
20%
|
40%
|
36%
|
29%
|
|
IT
|
18%
|
22%
|
24%
|
16%
|
|
FR
|
12%
|
6%
|
11%
|
16%
|
|
BG
|
6%
|
6%
|
3%
|
4%
|
|
EL
|
2%
|
8%
|
1%
|
3%
|
|
Other
|
9%
|
12%
|
13%
|
19%
|
|
LFA
|
42%
|
40%
|
42%
|
42%
|
|
Not LFA
|
58%
|
60%
|
58%
|
58%
|
|
Share by size
|
100%
|
100%
|
100%
|
100%
|
|
2 - 8 000 EUR
|
37%
|
62%
|
53%
|
47%
|
|
8 - 25 000 EUR
|
31%
|
22%
|
23%
|
23%
|
|
25 - 100 000 EUR
|
20%
|
12%
|
16%
|
21%
|
|
> 100 000 EUR
|
12%
|
5%
|
8%
|
9%
|
Source: JRC, IFM-CAP
The small farmer scheme, which was introduced in the last reform as a simplified way to grant direct payments to smaller beneficiaries is not retained in the options because it is simpler for beneficiaries (thanks to the greening exemption notably) but not for the administrations.
2.1.4.Cope with price volatility and improve risk management
The 2014 US Farm Bill introduced a system with risk-based (countercyclical) payments. In the public debate this system was sometimes referred to as being more adequate compared to the EU system with direct payments complemented by risk management schemes. In order to evaluate its impact, an analysis with the Aglink-Cosimo model was performed assuming the CAP to adopt some of the programs of the US Farm Bill 2014. For a comprehensive description of the US Farm Bill 2014 we refer to the USDA Farm Service Agency. Specifically, two of the US Farm Bill 2014 programs were considered: the acreage risk coverage (ARC), which is substantially a revenue-risk insurance, and the price loss coverage (PLC), which is an insurance against prices dropping below certain levels. The analysis solely focused on maize, barley and soft wheat. For the PLC program, payments are triggered when the market price is lower than an arbitrarily chosen reference price level. For the ARC program, payments are triggered when the farm revenue goes below a specific revenue of reference, which in the US can be farm- or county-specific.
Graph 2.10 Deterministic results for baseline and three scenarios for EU total ARC and PLC payments (in 1 000 EUR)
Source: JRC, AGLINK-COSIMO
The analysis shows ARC payments in the order of approximately half a billion € in the worst years for the average set of reference prices. For the highest set of reference price levels the payments are in all 10 years above 1 billion €. A similar picture but with much higher absolute levels in monetary terms is shown for the PLC program payments at the EU-wide level. In this case there is a one-to-one correspondence between market prices being below the reference levels and the payments. Every time the market price is below the reference level, the PLC payments are triggered. This is not the same as in the ARC payments, where there is a simulated distribution of farmers' revenues and the benchmark revenue to trigger payments is the multiplication of Olympic averages of market price and yield. No PLC payments are expected if the low reference prices are chosen and medium reference prices trigger payments up to 5 billion € in the year 2019 when lowest prices are projected in the Outlook for the three crops considered under the ARC and PLC programs. High reference prices trigger PLC payments of 14 billion € for the 3 crops considered. For the ARC and PLC combined, with high reference prices, payments in the worst case scenario exceed 15 billion €.
The main conclusions are hence that a system based on risk-based payments creates significant budget uncertainty and presents a real danger for budget overshoot, depending on the chosen reference prices in relation to market developments. Note that the presented analysis only covers three crops. Furthermore, a system based on risk-based payments also does not sufficiently transmit market signals to farmers, as downward price pressure is cushioned, removing the incentive to adapt production to changing demand and can lead to overproduction.
The market orientation of the CAP has significantly increased over time and at the same time the exposure to world markets. In a context of climate change and higher occurrence of extreme events, farmers’ exposure to yield, price and income variability will increase. Thus, the proposed increase in financial means dedicated to risk management tools in option 3a (10% of pillar I) and options 3b and 4 (5% of pillar I), while option 5 remains status quo. Currently the uptake of risk management tools is rather low also because farmers count on direct payments to buffer income changes, but simulated budget cuts and the shift in priorities towards less income support (option 3) might increase farmers’ willingness to adopt these tools.
Based on FADN data, between 2007 and 2015, on average annually 30% farmers had a 20% or larger drop in sector income compared to the three previous years and 25% of EU farmers had a 30% drop in gross farm income (see Annex 5.7). Would an income stabilisation tool be available for all farmers, an EU budget between 13 and 15 billion EUR would have been necessary annually to compensate farmers. It is far more than the budget foreseen in options 3 and 4. Anyhow, the level of organisation required to set up a mutual fund to manage an IST imply that most probably only larger farmers would opt for that solution (also because for smaller farmers the main preoccupation might be their income level – better addressed with direct payments – rather than its variability). If only farmers with an economic size above 50 000 EUR would opt for an IST, the budget need could be almost divided by two. This would require nevertheless a larger budget than available.
MS are given the possibility to set up the IST for specific sectors, in the framework of the strategic plan. This provides an opportunity for MS to target sectors facing some years huge drops in income and for which other risk management tools are less available. For example, risk management tools are less developed in the livestock sector than for crops. Crop futures are well functioning and available to farmers but also to insurers to cover/hedge their risks, thus the wider availability of insurance products (which can be supported with EU funds too). By contrast, in the dairy sector, the volume traded on futures is still small (though increasing) and an IST could be of interest to farmers to protect themselves against market uncertainty. In other sectors, where the first issue in income level (beef and sheep for example), direct payments (included coupled support) can be best suited to support farmers.
Table 2.9 Estimation of annual compensation needs for an IST in the EU
|
|
|
MEUR
|
|
Envelope made available for risk management tools
|
Option 3a
|
3 400
|
|
|
Option 3b&4
|
1 700
|
|
EU compensation required if IST for all farmers
|
Farm income, 30% drop
|
13 300
|
|
|
Sector income, 20% drop
|
14 900
|
|
Compensation required if IST for larger farmers (> 50 000 EUR of size)
|
Farm income, 30% drop
|
7 200
|
|
Compensation required if IST for selected sectors (Sector income, 20% drop)
|
Milk
|
1 300
|
|
|
COP
|
2 600
|
|
|
Sugar beet
|
200
|
|
|
Olive
|
600
|
|
|
Pig&poultry
|
1 400
|
Source: DG AGRI, AidsK, FADN data
2.1.5.Competitiveness
The options assessed here imply little change in the competitive position of the EU in terms of price competitiveness. Farmers opt for reducing production in view of lower expected returns and higher costs and the increase in production prices is very small. Therefore in all options, the relationship between costs and revenue remains more or less constant and farmers reduce their livestock (especially cattle, see above) and cereal area (grain maize and wheat).
Therefore a deterioration of the EU trade balance is to be expected, with increased imports of beef, sheep and poultry meat as well maize in almost all options and reduced exports of beef and wheat mainly. The trade of dairy products is not affected. The EU trade balance reduces most in option 4a and 3a, and then 3b and the lowest decline is simulated in options 4b and 5.
Table 2.10 Changes in trade by main commodity
|
|
Beef
|
Sheep meat
|
Poultry meat
|
Pigmeat
|
Cereals
|
Oilseeds
|
Oilcakes
|
|
|
Exports
|
Imports
|
Imports
|
Exports
|
Imports
|
Exports
|
Exports
|
Imports
|
Imports
|
Imports
|
|
3a
|
-13%
|
20%
|
8%
|
-2%
|
2%
|
-3%
|
0%
|
1%
|
1%
|
-2%
|
|
3b
|
-3%
|
4%
|
3%
|
-1%
|
1%
|
-2%
|
-3%
|
6%
|
0%
|
0%
|
|
4a
|
-9%
|
13%
|
2%
|
-2%
|
3%
|
-4%
|
-1%
|
3%
|
1%
|
-1%
|
|
4b
|
-7%
|
9%
|
1%
|
-1%
|
1%
|
-1%
|
0%
|
-1%
|
0%
|
-1%
|
|
5
|
-9%
|
13%
|
-6%
|
-1%
|
1%
|
-1%
|
-1%
|
1%
|
0%
|
-1%
|
Source: JRC, CAPRI
2.1.6.Coupled support and competitiveness
Where the market fails to remunerate farmers for all the services they provide and where the lack of support could lead to land abandonment and closed landscapes (e.g. for extensive livestock in grassland areas) a coupled payment can be justified to help maintaining production in territories and sectors at risk.
The table below highlights the impact on production, productivity and prices of removing coupled support (in isolation from other changes) compared to the baseline: a decrease in area and herd, an increase in productivity (dairy and sugar beet) mitigating production effects, as well as a price increases.
Table 2.11 Changes in price and production would coupled support be fully removed
|
|
Hectares or herd size
|
Yield
|
Supply
|
Price
|
|
Dairy
|
-0.7%
|
1.5%
|
0.7%
|
1.4%
|
|
Beef
|
-2.5%
|
0.2%
|
-2.4%
|
3.2%
|
|
Sugar Beet
|
-4.9%
|
2.2%
|
-2.8%
|
3.9%
|
Source: JRC, CAPRI
Coupled support has implications on the level playing field in the EU, because of the differences in implementation between MS, it might lead to unfair competition and to an increase in production. In addition, the World Bank in a recently published study, points out that coupled support prevents productivity increases contrary to decoupled and pillar II payments. The results also show that yield gains would have been higher without support for milk and sugar beet.
The voluntary coupled support, as currently implemented, addresses only in part EU concerns: close to 70% of the support is granted to the sheep, cattle and protein crop sectors. The targeting could be further improved by limiting support to extensive livestock providing positive amenities as proposed in options 4 and 5. For the rest of the coupled support currently granted, several issues can be pointed out:
·A lack of targeting: in the dairy sector for example, in several MS a large share of dairy cows are eligible, sometimes to small amounts (like in FR and BE, below 30 EUR/head) questioning the usefulness of the scheme and sometimes to large amounts (like in CZ and HU) questioning in this case the proportionality of the scheme and the competitive advantage given to these producers. Similarly, in MS granting a coupled payment to sugar beet, generally all the area is eligible.
·An impact on production.
·A contradiction with a market oriented policy. The use of coupled support can be questioned when it is used, like in the sugar sector, to compensate for the lack of competitiveness of a whole country (and not a specific territory). Clearly, in such cases MS have put forward the social dimension of the support which helps keeping employment in the related processing industry, however without addressing the structural issue.
·Competition issues. Coupled support introduces elements of unfair competition between MS. This can be illustrated with the coupled support granted to the sugar sector, where the aid granted in 2015 reached from 100 EUR/ha in FI to 800 EUR/ha in RO. In other words, in RO sugar beet growers received a coupled support of 20 EUR/t, while e.g. in BE where no VCS was granted, sugar beet growers signed contracts at 23 EUR/t. In addition, the CAPRI analysis shows that without support, RO would have produced 53% less.
·Disproportionate unit amounts may be paid: this happens, in absence of any 'safeguard', when to avoid unspent funds MS increase the unitary level of aid when there is a drastically smaller number of applicants than planned.
However, coupled support can address specific issues that the decoupled payment would otherwise leave unresolved. Coupled support could be limited and granted to sectors identified by MS as undergoing certain difficulties. This is why in options 4 and 5, coupled support was introduced to address some EU concerns. In option 3b, the possibility to grant coupled support was extended to sectors identified by MS as particularly important for social, economic, or environmental reasons, undergoing certain difficulties with the view to overcome these difficulties after a certain number of years.
2.2.Increasing the environmental and climatic benefits of the CAP
It is proposed in the new green architecture to remove EU exemptions and thresholds. It implies that all the potentially eligible area will be under minimum conditionality. In addition, in the options where entitlements can be removed (all except option 3b), the area covered by payments could increase and thus the area under conditionality (currently the area granted an aid is below 90% of the UAA). However, in this modelling exercise some exemptions were introduced to avoid overestimating effects of some requirements.
2.2.1.Contribute to climate change mitigation & adaptation
Reduce GHG emissions
Previous analysis shows that there is a need to give a dedicated incentive to farmers in order to reduce GHG emissions. The ECAMPA project (see Box 1) showed that, in the absence of a compulsory emission reduction target for agriculture, a subsidy covering 80% of the costs of mitigation technologies, could deliver significant non-CO2 emission reductions, with little negative impact on EU production. However, this measure would come along with considerable budgetary and unitary costs if farmers are projected to widely adopt the technologies, estimated at around the current total pillar II envelope. The fact that such incentives are not explicitly included in the present analysis (also because of its budget-neutral assumption) explains why only small reductions in non CO2 emissions compared to baseline are reached in this assessment.
In addition, this assessment is an underestimation of potential GHG emissions reduction because the impacts of land use change and carbon sequestration are not fully captured in the CAPRI model. However, the model accounts for changes in livestock diets and for the adoption of some mitigation technologies. The potential impact of targeted measures and other effects to reduce GHG emissions that could not be covered by quantitative modelling were taken on board in the different options of the MCA analysis (section 3.2.4.1).
The budget cut (Post Brexit) implies a 0.1% reduction of GHG emissions compared to baseline. In addition, all options show a small decrease of non-CO2 GHG emissions, ranging between 0.6% and 1.6%. Between 34% (4b) and 50% (4a) of the reduction comes from direct N20 emissions from the application of mineral fertilisers, followed by 22% (4a) to 36% (4b) from methane emissions from enteric fermentation. Even though the difference in impact between the options in terms of non-CO2 GHG mitigation is a factor of three, this represents only between 2.6 and 7 million t CO2 eq/year.
The main drivers for the reduction in non-CO2 emissions are the introduction of a tool for nutrient management with reduction targets of N-surplus. As the reduction target of the NMP is higher in option 3a and 4a compared to the other options, it is quite logical that these scenarios show the biggest reductions in terms of GHG emissions.
Farmers may react to these reduction targets via production changes but also via the implementation of mitigation technologies. Around 56% of the total reduction in GHG emissions is achieved via mitigation technologies in option 4a, while it is around 25%-45% in the other options. The major part of the reduction is due to precision farming and the use of nitrification inhibitors out of four farming practices. The results show as well that there is no adoption of other mitigation technologies in absence of any other incentive directly targeting non-CO2 mitigation technologies. It should be noted that in the ECAMPA2 study (see also Box 1), a scenario with a subsidy covering 80% of the costs of mitigation technologies but no compulsory emission reduction target for agriculture, delivered about 13.5% of non-CO2 emission reductions by 2030 compared to 2005, with little negative impact on EU production.
Box 1: What's the potential of GHG emission mitigation in agriculture?
The options considered in this impact assessment do not include specific GHG emission reduction targets or policy obligations to mitigate GHG emissions from EU agriculture. While the possibility for uptake of emission mitigation technologies is considered in the quantitative analysis, adoption by farmers is low (see section 2.2.1), which explains why the GHG emissions reduction achieved in the different policy options is limited. This is in line with the main findings of the EcAMPA 2 study (Pérez Domínguez et al., 2016), which shows that adoption of mitigation technologies in the agricultural sector is unlikely to happen at a large scale without additional incentives.
In the EcAMPA 2 study, the role of emission targets and subsidies for the uptake of technological (i.e. technical and management-based) mitigation options was specifically addressed with the CAPRI model for year 2030. The study examined the impacts of policy instruments directly targeting non-CO2 GHG emission reductions in the EU agricultural sector, concluding that without further policy incentives, EU-28 agricultural GHG emissions would decrease by about 2.3 % by 2030 compared with 2005. EU agricultural production would be significantly reduced if the sector was to deliver a -20% emission reduction without including subsidies for the adoption of mitigation technologies. Livestock herds would be substantially affected, especially cattle for beef production. Negative production impacts of a mitigation target would be more limited if the implementation of emission mitigation technologies by farmers would be subsidised. Furthermore, the study showed that considerable emission reductions could also be achieved when including subsidies for emission technologies without a specific emission target. In this case, emissions would decrease by about 13.5% compared to 2005, without negative impacts for EU agricultural production. However, EcAMPA 2 showed that the subsidies payed in the scenarios would lead to additional budgetary costs between 12.7 and 15.6 billion EUR (188 - 278 EUR/t CO2 eq mitigated) depending on the scenario setting (i.e. voluntary vs. mandatory adoption modalities, cost and number of technologies available, etc.).
Graph 2.11: Contribution of each technology to total mitigation (EU-28, 2030)
Source: Pérez Domínguez et al. (2016). HET20 = Compulsory 20% mitigation target for EU-28 agriculture, cost-effective allocation by MS; SUB80V_20 = same as HET20, but with 80% subsidy for the voluntary application of mitigation
The positive effect of a reduction in GHG emissions is partly offset by emission leakage, meaning increased emissions outside the EU, to produce agricultural products to be imported into the EU or to replace EU exports. Between 35% and 75% of the GHG emission savings are substituted by additional emissions outside the EU (the so-called leakage). This effect is the strongest in option 3a due to the strong decline of EU beef production replaced by imports from less efficient regions in terms of GHG emissions/kg of product based on the historical emissions efficiency trends as the exact impact of the Paris Agreement in different parts of the world is yet unclear. In general, all measures that lead to production drops imply a reduction in gross GHG emissions. However, only a change in human consumption will translate into an actual reduction of GHG emissions worldwide (i.e. to avoid leakage).
These average results hide diverging impacts at national and regional level due to the prevailing farming systems in the baseline. Another explanatory element is the implementation of the tool for nutrient management assuming that regions with a high livestock density need to reduce the nitrogen surplus with a higher percentage than regions with a lower nitrogen surplus.
Table 2.12: Relative contribution of emission categories to total emission reduction (%) in the different options
|
|
3A
|
3B
|
4A
|
4B
|
5
|
|
N2O from application of manure
|
3
|
4
|
3
|
4
|
4
|
|
N2O from grazing animals
|
7
|
3
|
5
|
9
|
8
|
|
N2O from manure management
|
3
|
3
|
2
|
3
|
3
|
|
N2O from application of mineral fertilisers
|
40
|
43
|
50
|
34
|
36
|
|
N2O from organic soils
|
0
|
1
|
1
|
0
|
4
|
|
N2O from crop residues
|
4
|
12
|
4
|
6
|
6
|
|
Indirect N2O from runoff and leaching
|
5
|
4
|
6
|
4
|
4
|
|
Indirect N2O from volatilised ammonia
|
3
|
3
|
3
|
2
|
3
|
|
Total N2O
|
65
|
73
|
75
|
62
|
67
|
|
CH4 from enteric fermentation
|
33
|
24
|
22
|
36
|
31
|
|
CH4 from manure management
|
2
|
3
|
3
|
2
|
2
|
|
Total CH4
|
35
|
27
|
25
|
38
|
33
|
Source: JRC, CAPRI model
Increase carbon sequestration
The maintenance of permanent grassland – i.e. obligation not to convert permanent grassland to other land uses - is key for carbon sequestration and preservation, thus the obligation to maintain the share of permanent grassland in UAA in conditionality requirements. In addition, other policy instruments can contribute to maintain or even extend permanent grassland area: support to permanent grassland (option 4 and 5), support to ANC and support to extensive livestock. It is worth noting that any scheme granting lower payments to large farms (as simulated in option 5) is damaging for extensive farms with permanent grassland; thus the need to compensate these systems with targeted support. In addition, the increase in green requirements might lead to an increase in permanent grassland by reducing economic returns from arable land.
Certain farming practices have also beneficial effects on soil organic carbon. There is substantial scientific evidence that cover crops reduce nitrate and phosphate leaching (water quality), increase the soil organic carbon content and reduce soil loss by improving soil structure and increasing infiltration. Experimental results have shown that cover crops can reduce soil erosion by 20% (conservative estimation); thus, the proposal for more environmentally ambitious MS to specify an obligation of winter soil cover with cover crops (meaning that mulching would not be enough). Cover crops are applied currently on 6.5% of the EU-28 arable land, but large differences between MS exist. The use of green coverage between tree rows of permanent crops ranges between 5 and 10% in the EU.
For this impact assessment, 3 scenarios were developed and run by the JRC, using the Century model and RUSLE 2015, to see the potential effect of cover crops on carbon sequestration and soil erosion, separately from the non-CO2 modelling with CAPRI described above:
·Scenario 1: introducing a minimum rate of cover crops in the whole EU territory, several levels were tested: 25%, 50% and 75% of arable land and permanent crops. In areas were the cover crops application was larger no change was implemented ("Flat rate 25%, 50%, 75%").
·Scenario 2: introducing minimum cover rates of 10% everywhere, but with higher levels depending on the erosion status of the zone: 25% if soil erosion is above 2t/ha per year and 50% if soil erosion is above 5t/ha ("Minimum + target").
·Scenario 3: introducing targeted cover rates only where erosion rate are above 1t/ha: 25% if soil erosion is above 1t/ha per year, 50% if soil erosion is above 2t/ha and 75% if soil erosion is above 5t/ha ("Target").
Cover crops application on arable land improves carbon sequestration in all scenarios. Between 37 and 138 million t of additional carbon can be accumulated into the soil over a period of 15 years. The impact by MS is mainly driven by the number of hectares of arable land and the potential erosion risk. On a yearly basis, the impact represents between 0.5% and 2% of total agricultural non-CO2 emissions (437 million t in 2015, EEA).
Table 2.13: Change in carbon sequestration cumulated over a period of 15 years due to different implementation strategies of cover crops on arable land
|
MS
|
Carbon sequestration (Mt)
|
Scenario 1 "Flat rate"
|
Scenario 2 "Minimum + target"
|
Scenario 3 "Target"
|
|
|
|
25%
|
50%
|
75%
|
|
|
|
AT
|
1.0
|
0.0
|
0.4
|
1.1
|
0.1
|
0.3
|
|
BE
|
0.2
|
0.0
|
0.3
|
0.6
|
0.0
|
0.1
|
|
BG
|
0.0
|
1.5
|
2.9
|
4.4
|
1.1
|
1.8
|
|
CY
|
0.0
|
0.0
|
0.0
|
0.0
|
0.0
|
0.0
|
|
DE
|
2.4
|
6.2
|
14.8
|
23.3
|
3.4
|
5.9
|
|
CZ
|
0.6
|
1.7
|
3.9
|
6.2
|
1.1
|
2.4
|
|
DK
|
0.0
|
0.7
|
1.4
|
2.1
|
0.3
|
0.1
|
|
EE
|
0.1
|
0.3
|
0.6
|
1.0
|
0.1
|
0.0
|
|
EL
|
0.0
|
0.4
|
0.8
|
1.2
|
0.3
|
0.5
|
|
ES
|
0.5
|
2.1
|
4.7
|
7.4
|
2.0
|
3.7
|
|
FI
|
0.1
|
0.8
|
1.7
|
2.6
|
0.3
|
0.1
|
|
FR
|
6.0
|
6.4
|
18.6
|
30.8
|
3.1
|
7.2
|
|
IE
|
0.1
|
0.4
|
0.8
|
1.3
|
0.1
|
0.1
|
|
HU
|
0.2
|
2.9
|
5.9
|
9.0
|
1.8
|
2.6
|
|
HR
|
0.0
|
0.0
|
0.0
|
0.1
|
0.0
|
0.0
|
|
IT
|
0.4
|
2.5
|
5.4
|
8.4
|
3.1
|
5.4
|
|
LT
|
0.1
|
1.3
|
2.7
|
4.0
|
0.5
|
0.4
|
|
LU
|
0.0
|
0.0
|
0.0
|
0.1
|
0.0
|
0.0
|
|
LV
|
0.1
|
0.4
|
1.0
|
1.5
|
0.1
|
0.1
|
|
NL
|
0.2
|
0.1
|
0.4
|
0.7
|
0.0
|
0.0
|
|
PL
|
1.6
|
4.2
|
9.9
|
15.6
|
1.8
|
3.2
|
|
PT
|
0.0
|
0.2
|
0.3
|
0.5
|
0.1
|
0.2
|
|
RO
|
0.2
|
3.2
|
6.7
|
10.1
|
2.4
|
3.8
|
|
SE
|
0.4
|
0.8
|
2.0
|
3.2
|
0.3
|
0.4
|
|
SI
|
0.1
|
0.0
|
0.1
|
0.2
|
0.0
|
0.1
|
|
SK
|
0.2
|
0.9
|
1.9
|
2.9
|
0.8
|
1.3
|
|
Total
|
14.4
|
36.9
|
87.3
|
138.2
|
22.9
|
39.8
|
Source: JRC, Century model
2.2.2.Foster sustainable and efficient management of resources
Reduce N surplus and improve water quality
This assessment explores how the introduction of Nutrient Management Plans (NMP) could contribute to improve water quality. Nitrogen and phosphorus loads are big issues for water quality. However, since the balance of phosphorus is not complete in CAPRI, the assessment concentrates on nitrogen.
Two nitrogen-restricting measures are tested:
1.The obligation for all farms to elaborate a Nutrient Management Plan (NMP) (i.e. not only in nitrate vulnerable zones, as it currently applies) as minimum requirement, this scenario with a tool for nutrient management is called 'NMP'.
2.A reduction target of nitrogen balance, as proposed in options 3a and 4a, this scenario is called 'NMP+'.
The JRC used the CAPRI model for the simulation. CAPRI approximates farm-level N-surplus with the Gross Nitrogen Balance (GNB). The GNB includes all N losses from housing, manure storage and management and soils. The two measures are mimicked as reduction targets of the GNB. The targets are defined relative to the level of the GNB per hectare of UAA in the baseline. EU regions are categorised according to their baseline N-surplus per hectare, and different reduction targets are applied for each category. For EU regions with already significant manure trade, lower reduction targets are applied. Reduction targets simulated are summarised in the table below.
Table 2.14: Relative N-surplus reduction targets in both scenarios
|
|
|
Number of NUTS2-regions
|
Target NMP
|
Target NPM+
|
|
GNB < 40 kg N ha-1 yr-1
|
|
93
|
0%
|
0%
|
|
40 N ha-1 yr-1 < GNB < 80 kg N ha-1 yr-1
|
|
95
|
0.6%
|
2%
|
|
80 N ha-1 yr-1 < GNB < 120 kg N ha-1 yr-1
|
|
37
|
1.5%
|
5%
|
|
120 N ha-1 yr-1 < GNB < 160 kg N ha-1 yr-1
|
|
17
|
3%
|
10%
|
|
GNB > 160 kg N ha-1 yr-1 – Manure trading
|
BE, NL, DE
|
12
|
1.5%
|
5%
|
|
GNB > 160 kg N ha-1 yr-1 - No manure trading
|
BE, IT, PT, ES
|
7
|
3%
|
10%
|
Source: JRC
Map 2.1: Reduction in N-surplus per ha of UAA (relative to baseline), NMP+ scenario
Source: JRC, CAPRI
Farms in CAPRI have two main options to reduce their N-surplus; they either adjust their current production structure (by e.g. reducing the number of animals, changing land allocation to crops or adjusting input use) or they can opt for more N-efficient farming practices. The latter effect is captured by a limited set of optional production technologies
: precision farming, variable rate technology, a better timing of fertilising, nitrification inhibitors and low N-feeding. The adoption of these technological options comes at a cost for farmers.
The imposed reduction targets are met in the scenarios, with an average reduction for the EU of 1% in the NPM scenario and close to 4% in the NPM+. Farmers take advantage of more N-efficient technologies, such as precision farming. Overall, the mineral fertiliser use is decreasing by 1.5% (option 3b) to 5.1% (option 3a) at EU level (see e.g. the mineral N use for cereals in the map below decreasing by more than 8% in the regions in dark green). The impact on agricultural income is very small, only about 0.2% in both scenarios for the EU. In the NPM+ scenario a small adjustment in the regional allocation of land use and animal production can be observed.
Map 2.2: Mineral N (fertiliser) use for cereals, relative change in kg of N use/ha, NMP+ scenario
Source: JRC, CAPRI
Reduce soil erosion
As illustrated in the map below, the regions requiring intervention to reduce soil erosion (regions in red and orange with a mean soil erosion above 2 t/ha) are numerous and located mainly in the southern part of Europe.
The same scenarios as for carbon sequestration were run for cover crops on arable land and on permanent crops to see its impact on soil erosion. The analysis shows that cover crops can potentially reduce average annual erosion on arable land by up to 15% and on permanent crops by up to 37% with a flat rate at 75% in the EU. Low requirement rates (below 10% of coverage of arable land and below 25% on permanent crops) would have little effect because MS apply already cover crops.
Map 2.3: Mean annual soil erosion
Green colours indicate regions without soil erosion issues, while regions in orange and red need to reduce erosion.
An implementation taking into account the on-site erosion risk would lead to similar reduction rates of soil erosion in the most vulnerable areas than a flat rate. However, it would have the advantage to be much better targeted to areas/countries with an erosion problem and would limit as well the additional burden to farmers.
Cover crops are clearly beneficial to reduce erosion but not enough: certain MS would still record erosion rates above 5t/ha per year for permanent crops and above 2t/ha per year on arable land in all scenarios. Therefore, the winter soil cover requirement would need to be combined with other measures, such as plant residues after crop harvesting, the increase of grass margins, contour farming in sloppy areas and reduced tillage, in order to reduce erosion to acceptable levels in all MS. Although it was not covered in the scenarios, several studies indicate that the type of cover crop (leguminous for example) and the duration of the vegetation cover are two factors that influence to a large extent the effectiveness of this farming practice.
Another way to reduce soil erosion is to develop and improve crop rotation. According to the H2020 Smartsoil project, improved crop rotations refer to specially tailored crop rotation regimes, such as alternating deep-rooted and shallow-rooted plants or alternating a series of crops with a period of grassland (grass-ley) and introducing catch or cover crops. These improved rotations can benefit farm soil by building soil organic matter, enhancing soil fertility and improving (deep) soil structure. Crop rotation has multiple benefits: it can help replenish nitrogen in the soil, reduce erosion, and increase the water infiltration capacity of the soil. Practicing crop rotation can also provide a simple technique for managing and preventing weeds, pests and diseases from building up when land is continuously planted with the same crop (monoculture) and thus contribute to the objective of reducing pesticide use. The simulation carried out by JRC showed that the rotation obligations proposed in the options imply indeed a reduction in grain maize and durum wheat areas more often cultivated in monoculture.
Table 2.15: Change in erosion due to different implementation strategies of cover crops on arable land
|
MS
|
Erosion rate in baseline (t/ha)
|
Share of cover crops
|
Minimum + target
|
Target
|
|
|
|
25%
|
50%
|
75%
|
|
|
|
AT
|
4.0
|
-4.5%
|
-9.6%
|
-14.2%
|
-1.9%
|
-4.8%
|
|
BE
|
2.1
|
0.0%
|
-3.1%
|
-8.5%
|
-1.6%
|
-6.1%
|
|
BG
|
2.5
|
-5.0%
|
-10.1%
|
-15.1%
|
-4.1%
|
-8.9%
|
|
CY
|
1.8
|
-5.0%
|
-10.0%
|
-15.0%
|
-1.0%
|
-5.0%
|
|
DE
|
1.8
|
-3.5%
|
-8.7%
|
-13.8%
|
-2.6%
|
-6.5%
|
|
CZ
|
2.5
|
-3.8%
|
-8.9%
|
-14.0%
|
-3.6%
|
-8.6%
|
|
DK
|
0.6
|
-5.0%
|
-10.0%
|
-15.0%
|
-0.9%
|
0.0%
|
|
EE
|
0.7
|
-3.8%
|
-9.0%
|
-14.2%
|
0.0%
|
0.0%
|
|
EL
|
2.8
|
-4.7%
|
-9.8%
|
-14.9%
|
-4.9%
|
-9.8%
|
|
ES
|
4.3
|
-3.5%
|
-8.7%
|
-13.9%
|
-5.3%
|
-10.4%
|
|
FI
|
0.5
|
-4.9%
|
-7.4%
|
-10.7%
|
-0.6%
|
0.0%
|
|
FR
|
2.0
|
-3.1%
|
-8.2%
|
-13.2%
|
-1.8%
|
-5.5%
|
|
IE
|
1.3
|
-4.3%
|
-6.1%
|
-8.2%
|
0.0%
|
-3.7%
|
|
HU
|
2.1
|
-4.8%
|
-9.8%
|
-14.9%
|
-3.9%
|
-8.2%
|
|
HR
|
1.7
|
-4.6%
|
-9.6%
|
-14.7%
|
-1.7%
|
-5.8%
|
|
IT
|
8.4
|
-4.3%
|
-9.4%
|
-14.2%
|
-8.6%
|
-13.6%
|
|
LT
|
1.0
|
-4.8%
|
-9.9%
|
-14.9%
|
-0.8%
|
0.0%
|
|
LU
|
4.5
|
-3.1%
|
-8.3%
|
-13.4%
|
-3.1%
|
-8.3%
|
|
LV
|
1.0
|
-4.0%
|
-9.1%
|
-14.2%
|
0.0%
|
-4.0%
|
|
MT
|
15.9
|
-5.0%
|
-10.0%
|
-15.0%
|
-10.0%
|
-15.0%
|
|
NL
|
0.5
|
-1.9%
|
-5.9%
|
-11.2%
|
0.0%
|
0.0%
|
|
PL
|
1.6
|
-3.7%
|
-8.8%
|
-13.9%
|
-3.1%
|
-6.7%
|
|
PT
|
2.9
|
-5.1%
|
-10.4%
|
-13.3%
|
-6.7%
|
-11.8%
|
|
RO
|
3.4
|
-4.7%
|
-9.8%
|
-14.8%
|
-7.5%
|
-12.5%
|
|
SE
|
1.1
|
-3.5%
|
-8.7%
|
-13.8%
|
-0.5%
|
-2.2%
|
|
SI
|
4.6
|
-1.3%
|
-6.5%
|
-11.7%
|
-2.4%
|
-7.6%
|
|
SK
|
3.5
|
-4.2%
|
-9.3%
|
-14.4%
|
-5.6%
|
-10.6%
|
Source: JRC, RUSLE 2015
Table 2.16: Change in erosion due to different implementation strategies of cover crops on permanent crops
|
MS
|
Erosion rate (t/ha)
|
Flat rate
|
Minimum + target
|
Target
|
|
|
|
25%
|
50%
|
75%
|
|
|
|
AT
|
6.6
|
0.0%
|
-8%
|
-29%
|
-7%
|
-25%
|
|
BE
|
1.5
|
0.0%
|
-3%
|
-25%
|
0%
|
-1%
|
|
BG
|
5.9
|
-1.7%
|
-17%
|
-37%
|
-11%
|
-30%
|
|
CY
|
5.4
|
-1.0%
|
-15%
|
-36%
|
-15%
|
-36%
|
|
DE
|
6.1
|
0.0%
|
-4%
|
-24%
|
-3%
|
-19%
|
|
CZ
|
4.4
|
-0.3%
|
-11%
|
-32%
|
-1%
|
-14%
|
|
DK
|
0.8
|
0.0%
|
-5%
|
-27%
|
0%
|
0%
|
|
EE
|
0.6
|
0.0%
|
-1%
|
-14%
|
0%
|
0%
|
|
EL
|
7.9
|
-0.1%
|
-5%
|
-27%
|
-4%
|
-25%
|
|
ES
|
8.8
|
-1.7%
|
-16%
|
-37%
|
-14%
|
-34%
|
|
FR
|
5.5
|
-0.5%
|
-10%
|
-31%
|
-9%
|
-27%
|
|
HU
|
4.9
|
-0.7%
|
-14%
|
-35%
|
-12%
|
-31%
|
|
HR
|
10.2
|
-0.3%
|
-5%
|
-26%
|
-5%
|
-26%
|
|
IT
|
16.7
|
-0.1%
|
-6%
|
-27%
|
-6%
|
-26%
|
|
LT
|
0.8
|
0.0%
|
-1%
|
-20%
|
0%
|
0%
|
|
LU
|
10.8
|
-0.6%
|
-2%
|
-22%
|
-2%
|
-22%
|
|
LV
|
0.9
|
0.0%
|
-2%
|
-15%
|
0%
|
0%
|
|
NL
|
0.5
|
-0.3%
|
-9%
|
-30%
|
0%
|
0%
|
|
PL
|
1.2
|
0.0%
|
-1%
|
-21%
|
0%
|
-3%
|
|
PT
|
5.4
|
-0.2%
|
-9%
|
-31%
|
-6%
|
-21%
|
|
RO
|
9.8
|
-0.1%
|
-7%
|
-29%
|
-7%
|
-29%
|
|
SE
|
0.9
|
0.0%
|
0%
|
-8%
|
0%
|
0%
|
|
SI
|
32.1
|
0.0%
|
-3%
|
-24%
|
-3%
|
-24%
|
|
SK
|
7.5
|
-0.3%
|
-9%
|
-30%
|
-9%
|
-30%
|
Source: JRC, RUSLE 2015
Reduce ammonia emissions
Ammonia emissions reduce between 0.3% and 0.8% in the various options. As the mitigation technologies available in the model are not directly targeted to reduce specifically ammonia emissions, the reduction comes from changes in production and input use. The reduction targets from the NMP are determining to a large extent the differences between the scenarios. A similar reasoning applies to the results for nitrate leaching, indicating a reduction between -1.4% (scenario 4b) and -4.5% (scenario 3a and 4a).
2.2.3.Preserve nature and landscapes
Landscape elements
It is proven that landscape elements contribute to maintain biodiversity; thus, the green requirement of 3% of UAA with non-productive elements (fallow land, afforested area and landscape elements) proposed and the top-up for linear elements in option 5.
As explained above, this green-requirement and the effect of this top-up could not be fully assessed because of the lack of knowledge on the extent of linear elements in MS (not to mention at farm level). JRC ran a first attempt to estimate this area. To that aim, the JRC used the LUCAS transects database. This work would need to be continued and data crossed with Copernicus information, but is gives already relevant information. It was not always clear if the linear element surveyed was part of agricultural area or not, thus the identification of dubious cases.
Table 2.17: Landscape elements in the EU
|
|
Excluding dubious cases
|
Including dubious cases
|
|
|
Length (1 000 km)
|
Area (1 000 ha)
|
Length (1 000 km)
|
Area (1 000 ha)
|
|
Grass margins
|
4 750
|
2 850
|
5 880
|
3 530
|
|
Shrub margins
|
690
|
420
|
1 170
|
700
|
|
Single trees bushes
|
600
|
300
|
730
|
370
|
|
Lines of trees
|
680
|
340
|
1 090
|
540
|
|
Hedges
|
2 370
|
1 190
|
3 310
|
1 660
|
|
Grove margins
|
120
|
70
|
240
|
140
|
|
Stone walls
|
970
|
100
|
1 550
|
150
|
|
Ditches
|
1 920
|
960
|
2 860
|
1 430
|
|
Total
|
12 120
|
6 220
|
16 850
|
8 540
|
Source: JRC, based on LUCAS
In addition, the JRC completed the work with the estimation of grass margins, shrub margins, single trees bushes, lines of trees, hedges and ditches at MS level. This estimation is to be taken with caution because of methodological caveats. However, it shows that two MS have more than 3% of their UAA with linear elements: NL and FI (see Annex 5.4).
Adding to this estimate Eurostat data on land fallow, it shows that the 3% of non-productive elements will be binding in 12 MS (CZ, LU, BE, BG, DK, IE, HR, SI, SK, DE, FR, AT), all the more because the obligation applies at farm level. It explains the strong increase in set aside and fallow land simulated in the various options, mainly at the expense of cereal area (
Table 2.2
and 2.3). A CAPRI simulation modelling this green requirement in isolation confirms these results. The drop in cereal area is smaller though as part of land reallocation is due to rotation.
Land abandonment
Maintaining the agricultural activity is the first requirement to preserve nature and landscape. In all options, except option 5 result in a small reduction in UAA because the drop in support is threatening farm viability implying a decline in UAA of 300 000 ha in option 1 relative to baseline. On top, the increasing green requirements lead to a further reduction by close to 400 000 ha (-0.3% relative to option 1) in option 4a and 350 000 ha in option 3a. No additional land abandonment is recorded in option 5 because green requirements are minimal and because several factors contribute to keep farmers in business in areas facing constraints: the top up to ANCs, to permanent grassland and the coupled support to extensive livestock.
Implementation of environmental top-ups in option 5
In this simulation, it was not possible to dedicate 30% of pillar I envelope of each MS to ANCs, permanent grassland, organic area and linear elements: first because of the lack of knowledge on linear elements; second and more importantly because the provision of these area types is unequal between MS. With the level of top ups simulated here, the share of the envelope dedicated to these top-ups is 22%. This illustrates limits of strict ring-fencing.
However, without accounting for linear elements, the envelope required to grant these top ups is above 30% in 7 MS (AT, FI, SI, LV, PT, LU and SK). Some MS have indeed more than 50% of UAA with permanent grassland (IE, HR, PT, SI, EL, LU, AT), more than 50% of area in ANCs (FI, MT, LU, LV, SI, CY, SK, AT, PT and RO) and large organic areas (AT, SE, EE, IT and LV). In these MS, in this simulation, the envelope dedicated to the decoupled payment was therefore cut leading to stronger drop in support outside ANCs.
Conversely, in MS with less area classified with natural constraints and less permanent grassland, in this simulation the share of envelope dedicated to the tops ups was below 10% in DK and HU and below 20% in NL, BE, DE, BG, LT, PL and SE. In that case, the budget was allocated to the decoupled payment modulated by size.
In addition, in some MS the top-up simulated here was below the current ANC payment accounting for co-financing and national top ups. This highlights, in MS with large support to ANC relying currently on national funds, the potential difficulty to keep similar support levels in a pillar I framework. In these cases, it should be seen how the flexibility of the strategic plan could allow MSs to adapt the mix of interventions to maintain support in ANCs. Anyhow, in this simulation the current ANC support was always maintained.
Finally, would these top-ups be introduced, more flexibility on the envelope share should be envisaged. In addition, it might be needed to extend the scope of the top-ups to certifications.
2.2.4.Additional elements to enhance environmental and climate performance
To assess better the behaviour of farmers when confronted to the new green architecture proposed in the reform, the JRC organised focus groups with farmers. Farmers were separated in two groups: the farmers more inclined to adopt green practices 'Green farmers' and those more conventional. The first group associates green incentives to voluntary schemes, the latter to mandatory schemes. Voluntary schemes are perceived as more encouraging, though if not at the cost of reduced basic payments. Cross compliance (conditionality) is well accepted by farmers, but they are concerned for the level playing field when rules applied differ between MS but also as regards more competitive imports originating from third countries not complying with similar requirements. Greening is judged overall positive even though some concerns were expressed. As regards, agri-environment-climate measures farmers mentioned that the key factor to enrol is the economic dimension. More details are available in Annex 8.
Some additional key insights could be derived already from this work on farmers' opinion: the need for a better local knowledge to design coherent/meaningful incentives, the strong call for improving the level-playing field between farmers as regards voluntary schemes and the potential subsidiarity left to MS, the need to target incentive schemes to 'real' farmers and to small farmers and finally the need to better educate consumers.
The role of the economic incentive is further demonstrated by the economic analysis concluding to a high uptake of the eco-scheme, despite the associated costs due mainly to decreased agricultural production, because the aid is necessary to ensure the viability of the farm. In addition, according to the ECAMPA study carried out by JRC, adverse effects of binding emission reduction targets on EU agricultural production and emission leakage are significantly reduced if subsidies are paid for the adoption of technological GHG emission mitigation options. However, this comes along with considerable budgetary and unitary costs if farmers are projected to widely adopt the technologies.
3.Multi Criteria Analysis
3.1.Introduction
This part of the annex presents the results of the option comparison, combining both quantitative and qualitative approaches, as outlined in the Annex on Methods and tools. In section 3.2 the Effectiveness of the options towards the policy's Main Objectives (MOs) is assessed. Section 3.3 focuses on the Efficiency of these policy options, and assesses their contribution towards simplification, while section 3.4 addresses the cross-cutting objective of Modernisation. Section 3.5 discusses policy Coherence while the final section focuses on the cross-cutting objective of Sustainability.
A detailed overview of the achievements and shortcomings of the current policy, resulting into the set of identified challenges from which the specific objectives originate, can be found in the Background documents (see Annex 1 to the IA report).
3.2.Effectiveness of policy options
3.2.1.Overall scores on effectiveness
Effectiveness analysis considers how successful the options could be in achieving or progressing towards the new CAP objectives. Given the high aggregation level of the Main and Specific Objectives, this Annex describes effectiveness not only at these levels but also draws lessons from the Operational Objectives (OO) level (Annex 5.3). The group expert judgements were done at the level of OOs, to allow for sufficient refinement in the argumentation. The MCA exercise was prepared in DG AGRI in 2017 and run in January 2018.
Effectiveness is judged towards the economic, environmental and climate and social policy objective of the CAP. Graph 3.1 reflects the overall scores of the different options, including sub-options of 3 and 4. None of the options come close to the theoretical maximum (100), so combining the strong points of the different option designs will further increase the performance. One should however not neglect potential trade-offs between policy objectives, hampering a perfect score.
When applying an equal weight between the three main policy objectives option 5 attains the highest overall score. Option 5 combines several redistributive elements, especially towards smaller farms, with a strong EU–wide focus on environmental aspects.
When considering sub-options a and b in the other options, option 5 is matched by option 3a which offers high environmental ambition by means of a voluntary eco-scheme together with increased risk management instruments and cooperation measures. The sub-options help to test MS ambition in a delivery model based on increased subsidiarity. The distance in scores between options a and b reflect uncertainty regarding the level of MS' (mainly environmental) ambition. As a take away, if ambitious MS choices are desired, sufficient safeguards at EU-level should be put in place.
The distance in scores between options 4a and 4b is smaller compared to 3a and 3b. This is partly linked to increased uncertainty related to a voluntary incentive-based eco-scheme (option 3) vis-à-vis the compulsory enhanced conditionality (option 4a), and partly to the fact that option 4a and b have opposite preferences regarding the main policy objectives. This can also be seen in Graph 3.2. While option 4a is outperformed by option 4b for the economic and social objective, it is the opposite for the environmental objective, given its higher environmental ambition. Option 3a also scores high for the economic objective, as it is associated with faster structural change and hence productivity increase.
|
Graph 3.1. Option scores on overall effectiveness (100=maximum)
|
Graph 3.2. Option scores on economic, environmental and social policy objectives
|
|
Note: Amb-Cons includes the ambitious (a) and conservative (b) sub-options of option 3 and 4
|
|
Graph 3.2 also shows that in general the options underperform on the economic objective, compared to the other 2 objectives. The policy compensates for the provision of public goods, which are not sufficiently rewarded by the market, resulting in better scores on the environmental and social objective. For the economic objective it remains a second best to properly functioning markets. The large spread between the ambitious and conservative sub-options (both for option 3 and 4) mainly originates from a different contribution towards the environmental objective, as the main option design differences relate to the environmental ambition. Option 5 achieves a remarkable score for the social objective as this option contains a mix of instruments which is geared towards the social objective.
|
Graph 3.3. Option scores on overall effectiveness when different weights are applied
|
When assessing the robustness of the results by testing different weighting for the policy objectives (as exemplified in graph 3.3) the gap between option 5, 3 and 4 is further closed. The alternative weights proposed here reflect the current budget allocation to the different policy objectives, and can be seen as revealed preference. So depending on the importance of the different policy objectives pursued, the mix of policy instruments should be different.
|
|
|
|
3.2.2.Economic Policy Objective: Fostering a smart and resilient agricultural sector ensuring food security
As stipulated in the Treaty, supporting farmers in attaining a fair standard of living is one of the cornerstones of the CAP. The way this support is distributed among farmers is often criticised, since 80% of support goes to 20% of the farmers, as mentioned in the Communication. The options test different designs for distributing support, with changes in emphasis on minimum requirements, redistribution, capping and targeting complemented with different budget allocations for RD instruments such as the competitiveness or cooperation measure or the EIP budget. Option 3a, with its eco-scheme, starts from low basic payments combined with an increased budget for risk management and an incentive scheme geared towards environmental ambition. Option 4 tests jointness by coupling direct income support with extra environmental requirements. It also redistributes towards permanent grassland, which is associated with lower incomes. Option 5 targets small and medium size farms.
Graph 3.1 shows that none of the options attains a high score. This indicates that none of the options has a set of instruments which is clearly preferred over the others. While some (combinations of) instruments might contribute more to one economic objective, they are less fit for another. The lower score also reflects the tension between instruments geared towards supporting income directly versus instruments which improve the productivity and competitiveness of farming and hence increase income indirectly.
A second observation relates to the large uncertainty surrounding options 3 and 4, as reflected by the scores of the respective sub-options a and b. A delivery model based on increased subsidiarity will perform significantly better when additional safeguards are in place. In relation to this, options 3 and 4 have a similar overall score, but variation is much wider between 3a and 3b compared to 4a and 4b. So for the economic objective one could consider option 4 to be the preferred in absence of a clearer idea whether MS choices in the new delivery model will be more ambitious or conservative.
Remarkable is also that option 4b is preferred over option 4a (as opposed to 3a versus 3b). Option 4b is less environmentally demanding and hence associated with higher economic performance. Both model results and experts seem to judge the trade-off between the economic and environmental objective to be stronger compared to potential synergies. The opposite is true for option 3a, but for a different reason. Many experts believe that a reduction in direct support, which is strongest in option 3a, will trigger faster structural change, where only more efficient and productive farms will survive, resulting in a more economically performant agricultural sector. This off course comes at the detriment of the social (and potentially environmental) dimension. The low score of option 5 can also be interpreted in the same way. Its strong focus on small farms is hampering structural change and so limiting possible economies of scale. As shown in Graph 3.4, to reach the main economic objective the baseline with budget cuts is assumed the least appealing policy option. Main reasons for the low scores of the baseline with cut are the lack of targeting, strong VCS and low EIP spending, as well as the low budget for aid to producer organisations.
For the main economic objective, 3 Specific Objectives (SO) are identified:
·SO1: Supporting a viable farm income and resilience throughout the territory
·SO2: Enhance competitiveness and market orientation
·SO3: Improve farmers’ position in the value chain
In the group weighting exercise, SO1 received a weight of 33%, indicating that in order to reach the main economic objective, 33% of the weight should be put on this SO. SO2 is assessed to be the most important (weight of 43.5%) and SO3 the least (23.5%). The distribution of expert weights is fairly homogenous, with one part of experts more in favour of the direct effect of policy support on income via SO1, while other experts see more virtue in policy support to enhance farmers' competitiveness, with knock-on effects on income.
|
Table 3.1. Option scores for main economic objective and the 3 specific objectives
|
Graph 3.4. Option scores on main economic objective (100=maximum)
|
|
|
|
Taking into account the scores on the SOs, the baseline with cut has especially a low score for SO3, as all other options have a higher budget allocation to improve the uptake of PO's. Option 5 is especially outperformed on SO1 and 2, due to its lack of spending on risk management and the main focus on small farms which are, overall, deemed less efficient. Options 3 and 4 have fairly homogenous scores across SOs, with 3 preferred over 4 for SO3 as the strong structural change it brings will stimulate farmers to get better organized, while the maintenance of a strong direct payment in option 4 brings merits to SO1 and especially 2, as it allows farmers to invest in productivity enhancing investments while not distorting market signals.
3.2.2.1. SO1: Support viable farm income and resilience throughout the territory
This SO focuses on the income level and variation and hence considers the following 3 OOs:
·OO1.1: Provide income support in a targeted way
·OO1.2: Cope with price volatility
·OO1.3: Improve risk management
The direct effect of the policy on the income level and its targeting is dealt with under OO1.1. One would expect a high weight for this OO given the importance of the direct payments in the overall CAP budget. This is only partially confirmed in the group weighting, as it receives 37% of the weights for this SO, but the SO itself only receives 33% of the weight of the Economic Policy Objective. The part on quantitative analysis (see section 2) already details the main messages. The relevant model outcomes are also integrated in the MCA, accompanied by the group scoring exercise. The following model indicators were considered in addition to the expert judgement (all equal weight for this OO):
·Increase income level in agriculture
·Targeting support to farmers most in need (with low incomes)
·Reducing share of farms with negative income
·Targeting payments to small and medium economic size (ES) farms
Graph 3.5 shows the virtue of combining both expert judgement and modelling results, when available. Although the modelling is not capable of capturing all intended policy effects, the experts seem to have underestimated the performance of the baseline and the baseline with cuts (option 1), while option 4 (a and b) were overrated. The high BP and the redistribution to farmers with lower income in option 4 (via increase in the permanent grassland payment and VCS to extensive livestock) are apparently offset by the budget reduction, other budget allocations (e.g. towards EIP or risk management) and the additional environmental constraints. For the other options the scores are in line. While the baseline outperforms the other options (given the higher budget), also option 1 performs well, almost similar to option 4b. Option 5 performs best given the budget cut, especially on targeting economically small farms and reducing the share of farms with negative income, given its redistribution towards small farms and the ANC payments in pillar 1. Option 3a is outperformed as it is targeting environmental needs and has a very low and flat basic payment.
Graph 3.5. Option scores on indicators associated with OO1.1 Provision of income support in a targeted way
OO1.2 on coping with price volatility links to the safety net measures but also to other instruments such as futures markets and forward contracts. For these items there is not much distinction between the options. All options embed the agreed Agricultural Omnibus. Option 3a scores best as the reduction in DP will benefit the more efficient farms and will stimulate the development of price risk management tools such as futures and contracts. The enhanced support for producer cooperation under 3a will also be beneficial as large cooperatives are the main users of these tools. VCS (considerable in option 3b and 5, small in 4) receives a negative marking given that it increases output and hence puts pressure on prices. Option 5 scores the least as it is not expected that small farms will become users of futures and the lack of structure might generate occasional mismatches between supply and demand.
|
Table 3.2. Option scores for SO1 Supporting viable farm income and resilience and its 3 OOs
|
Graph 3.6. Option scores on SO1
|
|
|
|
OO1.3 on risk management (RM) complements the previous objective in addressing volatility (of production and income). The group expert judgement should be set against the observations made in the modelling section, among others on the high budgetary expense for sector-wide ISTs and the low uptake of RM tools. The group experts confirm the latter and link it to the income buffer provided by DP. In an environment with lower DP, RM tools would become more popular. The experts also stress the importance of cooperation (and tools stimulating this) to facilitate risk management uptake. The group exercise puts option 3a on top as the reduced levels of DP and the absence of VCS together with a high budget for RM and cooperation will stimulate the interest in IST. Part of the experts sees more virtue in option 4 with higher DP. Option 5 is considered worst as there are no specific measures to tackle risk management while the focus on small farmers might trigger a further need.
3.2.2.2. SO2: Enhance competitiveness and market orientation
The successive CAP reforms have improved the market orientation of EU farms. This is important for the competitiveness of the sector, also in the light of international agreements, and for matching EU consumer demands with respect to price and non-price product attributes. This SO can be broken down in 3 OOs:
·OO2.1: Productivity and efficiency gains
·OO2.2: Demand driven production models
·OO2.3: Add value to agricultural products
|
Table 3.3. Option scores for SO2 Enhance competitiveness and its 3 OOs
|
Graph 3.7. Option scores on SO2
|
|
|
|
Reaching the first OO on productivity and efficiency gains is judged by the experts to be the most important in contributing to the overall Economic Policy Objective (with a weight of 17% overall or within this SO of 40%). Productivity is only growing at a low pace in the EU, and its spread is uneven. The effect of DP on productivity is not unilateral. While the recent World Bank study shows a strong and positive overall effect, DP are also associated with a slowdown in structural change as they allow less efficient farms to survive. DP are also partly capitalised in land prices, but as stable source of revenue they allow investments and can be used as collateral with banks. The positive effect of VCS is more contested as it draws away support from more to less productive sectors. For sectors in need VCS could act as a stimulus to enhance competitiveness. However, experts see the need for accompanying measures and a time limit to not distort competition in the single market. Other important measures are Producer Organisations (POs) as well as support for investment in physical assets and in human capital (knowledge and advice). Option 4 is judged best as it combines a high level of targeted DP with a high budget for competitiveness and EIP, while keeping VCS low. 4b is preferred as it is less environmentally demanding compared to 4a. 3a also scores well given that the low level of DP will trigger a restructuring in the sector. Absence of VCS and a high EIP budget are also judged beneficial. The baseline attains a fairly low ranking, despite the higher overall budget. Option 5 is judged worst as the focus on small farms makes reaching economies of scale more difficult.
Stimulating demand driven production models (OO2.2) is also seen as important (overall weight of 12% or 28% for this SO). EU consumers are by far the most important buyers of EU agricultural products. To meet their evolving demands both price and non-price attributes need to be aligned with consumer expectations. While OO2.3 focuses on adding value to agricultural products (the non-price attributes), this OO focuses on the price and trade component. EU prices in tune with world prices and a positive trade balance are indicative for a competitive EU farming sector. Group experts stress the importance of the capacity to adapt to changing market conditions and consumer preferences. Decoupled payments, as opposed to coupled payments, are seen as beneficial for market orientation, but, as in the previous section, they are assumed to slow down structural change. Higher environmental requirements are expected to put constraints on the production potential, with only limited pay-back from the market (see OO2.3). Strong support for competitiveness is positively associated with this OO. According to experts, option 4b scores best, as it combines a high level of DP and EIP with low environmental constraints and low VCS. 3a also scores well, but here mainly because the reduced DPs and absence of VCS together with the high EIP and Competitiveness budget (which contains support for quality schemes, setting up of POs and investments under the RD pillar) will allow restructuring and hence more market orientation. For this OO, option 1 is judged better than the baseline, due to the lower DPs and VCS triggering market orientation. Option 5 is judged worst given high VCS and the focus on small farms which will not allow being price competitive. The modelling results on net trade on the other hand favour the baseline and baseline with cuts, while also option 5 scores better. This might indicate that the experts underrated the effects of the budget cut and the more stringent environmental requirements (Graph 3.8), as the baseline and option 1 perform much better while especially 3a and 4a much worse. The reduced budget and the environmental requirements result in production contraction, affecting the EU's export potential while increasing the imports. On the other hand, the CAPRI model is not capable of capturing the effect of all tested instruments simultaneously, e.g. redistribution towards smaller farms, showing the virtue of combining both quantitative and qualitative assessment.
Graph 3.8. Option scores for OO2.2 combining expert judgement and modelling results on net trade
The third OO on Adding value to agricultural products (overall weight of 14% or 32% for this SO) is also seen as important in helping farmers to better respond to market demands and to retain more added value in the agricultural sector. Quality schemes, organic farming, Geographical Indications (GIs) and more integration in the bioeconomy are all associated with this OO. Both organic and GIs profit from support for quality schemes under RD, while GIs also benefit from the Promotion policy and organic farming is exempted from environmental obligations (such as greening under the current CAP). Several measures are currently promoting the integration in the bioeconomy, most notably Focus area 5c under RD and Leader. Group experts associate higher DPs with a lower incentive to convert to organic or to seek other ways of adding value. Massive conversion to organic could saturate the market, but with only 6.5% of the total UAA being organic, there is still ample room for growth. Option 5 is judged best given the top-up for organic, high expenditure on Leader, strong RD support for adding value and for the development of short supply chains. 3a follows as the low income support, together with an increased EIP and cooperation budget, will force farmers to seek alternative ways to add value. Option 1 is judged worst.
3.2.2.3. SO3: Improve farmers’ position in the value chain
Important changes to the provisions for farmers to get organized were agreed within the Agricultural Omnibus. The options do not assume changes to these provisions, but assume a different budget allocation for the setting up of POs and short supply chains. Some indirect effects from other policy instruments are also expected to influence farmers' position in the chain.
For this SO, 3 OOs were defined:
·OO3.1: Strengthening cooperation amongst farmers (horizontally)
·OO3.2: Enhance synergies within value chain (vertically)
·OO3.3: Support the development of local markets and short supply chain
|
Table 3.4. Option scores for SO3 on farmers' position in the value chain and its 3 OOs
|
Graph 3.9. Option scores on SO3 (100=maximum)
|
|
|
|
Overall, the baseline with post-Brexit cut is the least preferred, as it is a status quo compared to the current situation with additional budget cuts which will bear on the farmers' ability to get organized. Option 4 is also less favoured, as not many additional actions are proposed to get farmers organized. Experts also do not see differences between 4a and 4b for this SO. Option 5 scores better, starting from the premise that small farms have more incentives to get organized compared to large farms, as well as an increased budget for the set-up of short supply chains, also associated mainly with small farms. Option 3 is assessed best, mainly due to the reduction in direct payments, together with a higher budget for risk management, which will stimulate cooperation among farmers, as they will have to become more efficient to gain more from the market.
To reach this SO, the OO3.1 focusing on the organization of farmers within POs, is expected to be most important (weight of 45%). The assumption across options that multiannual sectoral programs are brought under the CAP planning process is seen as beneficial for farmers getting organized. Option 3a is preferred as it combines stimulating measures under rural development for the setting up of POs (under the Cooperation measure) with a high budget for EIP and lowest budget cuts on Competitiveness. As said, lower DPs and enhanced risk management are also expected to contribute to farmers' cooperation. Option 5 also receive a high score given the assumption that (part of) small farms have more incentives to join POs given their low bargaining power, together with high spending for setting up of POs and EIP. In option 4 there is strong focus on innovation, but no specific focus on producer cooperation and competitiveness.
OO3.2 on enhancing synergies in the value chain is associated with better price transparency and increasing added value creation in the food chain. This OO receives a weight of 27%. The experts assume that less income support would lead to disappearance of small and less efficient farms. The resulting increase in concentration would make it easier to bargain for the farming sector. There was also general agreement that VCS blurs market signals. Option 3a scores best given the low DP, which is an incentive towards cooperation, and more innovation. Option 4 also receives a high score given the high budget for innovation, low VCS and DP not distorting market signals. Favourable for 5 is the support for more basic services and the high EIP budget, while the strong VCS and vertical integration being harder to achieve for small farms are judged less effective.
For OO3.3 on local markets and short supply chains, with a weight of 29%, option 5 outperforms the other options as the redistribution towards small farms and the top-up for organic farms are also seen as positive for the development of alternative market channels. This is further stimulated by increasing the support towards short supply chains in RD and a higher budget for LEADER. The lower DP in option 3 will trigger (some) farmers to cope with market shocks by diversifying towards other market channels such as the short supply chains, so this is judged positive. The maintenance of high levels of DP together with lower budget for LEADER are seen as less positive for option 4.
3.2.3.Main Socio-Economic objective: Strengthen the socio-economic fabric of rural areas
The social dimension of the CAP is typically more difficult to measure and assess as many other policies and forces are at play as well. Rural dwellers other than farmers can profit from support under the second pillar, but with many challenges and a lower budget compared to the 1st pillar, the CAP's impact there remains limited.
For the main socio-economic objective, 3 Specific Objectives (SO) are identified:
·SO1: Attract new farmers and facilitate business development, as well as generational renewal
·SO2: Promote employment, growth and local development in rural areas
·SO3: Address territorial imbalances, rural poverty and social inclusion
In the group weighting exercise, SO1 received a weight of 23%, indicating that generational renewal is considered an important part of the socio-economic objective. SO2 is assessed to be the most important (weight of 42%) and SO3 the 2nd (35%). The distribution of expert weights is fairly homogenous.
As the table shows, the baseline with cuts (option 1) is considered the least appealing, followed by option 4. It receives an overall mediocre score as it performs poorly on the first SO of generational renewal, given that there is no increase in support for young farmers, no additional expenditure on basic services and Leader while a high level of DPs is retained which incentivises older farmers to remain in business. Also on the 2nd SO it receives a fairly low score as it is expected to neither create much additional employment in rural areas nor give a stimulus to more provision of rural services and infrastructure. Option 3 scores better than the baseline and option 4 given more incentives for generational renewal (esp. 3a), rural employment and growth, while imbalances between territories and groups are better addressed (in 3b). Option 5 outperforms the rest as it is built around redistribution towards small and medium farms, not containing extra minimum requirements. It also offers VCS, ANC payment, top-ups for organic and young farmers, high EIP, high AECH, high Leader and high basic services. One could say that this option was geared around the social pillar. In the group discussion the topic of short versus long run effects emerged as important. Social gains in the short run can be offset in the long run due to the erosion of the EU agriculture's competitive position and the creation of a "culture of dependency" to subsidies.
|
Table 3.5. Option scores for main socio-economic objective and the 3 specific objectives
|
Graph 3.10. Option scores on main socio-economic objective
|
|
|
|
3.2.3.1. SO1: Attract new farmers and facilitate business development, as well as generational renewal
Only one OO, Fostering generational renewal in rural areas, is associated with this SO. Young farmers on average have larger farms, with more rented land. They relatively invest more and find access to land and credit constraining. Their income is about average. They are also more often engaged in organic farming. Main uncertainty during the group discussion related to the positive or negative effect of DP on generational renewal. With higher DP, older farmers are more reluctant to leave the sector, while part of the payments are also absorbed into land prices, making access more difficult (even if it was stressed that land capitalisation depends heavily on MS land regulation). On the other hand, as collateral DP can facilitate access to credit and they offer a stable source of income.
|
Option 5 ranks highest because of the high Young Farmer (YF) top-up under DP, the support to organic, more budget for Leader, for infrastructure and services, EIP, cooperation etc. 3a also scores well, given the high top-up for YF, and a high budget for Competitiveness, good for young farmers who want to invest, and the low DP which will force some farmers out of the sector. Given its higher budget, the baseline also scores well. 3b has less budget for YF and lower spending on EIP, but high budget for competitiveness and for basic services. 4 scores less as there is no elevated YF payment and lower budget for basic services and Leader, while the high DP keep older farmers in business.
|
Graph 3.11. Option scores on OO1.1 Generational renewal
|
|
|
|
3.2.3.2. SO2: Promote employment, growth and local development in rural areas
This SO2 brings together 4 OOs:
·OO2.1: Foster employment in rural areas
·OO2.2: Foster income and value added (VA) in rural areas
·OO2.3: Foster inclusive growth in rural areas
·OO2.4: Improve access to infrastructure and services in rural areas
The OO on income and VA creation (with weight of 32%) is considered most important, followed by access to infrastructure and services (29%).
The OO on fostering employment covers both agricultural and non-agricultural sectors in rural areas, with the CAP being only one of the factors having effect on it. It considers both the creation and the maintenance of jobs in rural areas. Farmers only cover 12% of employment in rural areas. During the group discussion many uncertainties emerged. One relates to small farms, which are often occupied by part-time older farmers, to complement their pension. Incentivising these can be seen as socially desirable but not economically. Further, DP are less directly associated with the creation of jobs but they are more with the maintenance of jobs, while RD measures are more associated with the creation of jobs. The quality of jobs is also an important element, while low quality jobs in agriculture can be found in both big and small farms. A negative correlation between knowledge and innovation and employment is assumed, as it has the potential to replace labour by less costly inputs. Higher environmental demands may have a link with increased labour intensity but they also affect the available budget for other measures. Also VCS has pros and cons as it keeps people in otherwise less viable sectors but with long term negative prospects and additional pressure on sectors/regions where VCS is not applied. With respect to option scoring, option 5 is considered best as it directs support to more labour intensive farms (small, organic), it offers VCS, it has a high budget for Leader and Basic services and infrastructure, it promotes Cooperation and Diversification. 3b follows as it has highest Leader and Basic services, supporting off-farm employment, as well as VCS. The baseline is ranked third due to its higher overall budget for RD measures. The lower score under 3a is explained by the lower DP outbalanced by higher expenditure for Leader and Competitiveness. Option 4 is ranked lower given the lower expenditure for the relevant RD measures.
|
Table 3.6. Option scores for SO2 on employment and growth in rural areas and its 4 OOs
|
Graph 3.12. Option scores on SO2
|
|
|
|
For OO2.2 on fostering income and VA, focus rests on the competitiveness of rural areas, while fairness is considered in other OOs. EIP is seen as particularly important as it can push economic development. Although there were different opinions among participants, option 4 was ranked highest, as it has the highest BP and lower VCS, which is associated negatively with competitiveness. Budget for EIP is also high. Financial instruments to compensate for the reduction in the Competitiveness budget were also perceived as beneficial, as opposed to the lower budget for Leader and Basic services. 4b ranked first as it is less environmentally demanding compared to 4a. There was strong disagreement about option 5's ranking, as some see it as the least efficient in the long run, while others see the virtue of measures such as organic, short supply chains, diversification, basic services to boost competitiveness. As a consensus the option was ranked after option 4. Option 3b follows, given its lower budget for EIP, but high Leader. Option 3a has high EIP, but also high environmental requirements, explaining its lower ranking. The baseline is not preferred as it has a lower budget on EIP and some other RD measures, while the option 1 receives the lowest score given the budget CAP on top of that. While farm income development is only indicative for general income development in rural areas, it is worthwhile including it to complement the expert judgement. As already discussed in paragraph 3.2.2.1, the modelling (Graph 3.13) shows that the experts have somewhat underrated the effect of the budget cut, the redistribution and the higher environmental requirements in the new options, which are bearing on farmers' income. Including modelling results pushes up the scores for the baseline and option 1, while especially option 3a and 4 have to be revised downward.
Graph 3.13. Option scores for OO2.2 combining expert judgement and modelling results on EU28 farm income
For OO2.3 on inclusive growth, the group discussion revealed the importance of covering both 'inclusiveness' and 'growth'. Important instrument are Leader, public services, minimum requirements, salaries correction for capping, ANC-top ups and budget for diversification as it can give an impetus to small businesses. According to experts, option 5 is ranked highest, as it has low minimum requirements, a strong redistribution to small, ANC-top ups, VCS and high RD-budgets. 3b follows given its high budget for Leader. 3a is judged low given the flat and low basic payment and no redistribution. This last point is confirmed when including modelling results on the gini-coefficient of income. Based on modelling results, the baseline and option 1 perform much better compared to the experts' expectations while 4a and especially 5 attain a lower score. This might indicate that the budget cut but also the additional requirements on environment are not compensated by the effects of a more targeted redistribution.
Graph 3.14. Option scores for OO2.3 combining expert judgement and modelling results on the Gini-coefficient for EU28 farm income
For the OO2.4 on access to basic services and infrastructure (that according to the experts should not only be limited to broadband), the assessment was straightforward given the specific RD measure devoted to this. Also Leader was taken into account. 5 scores best as it has the highest budget for basic services and Leader, followed by 3b. 4 scores similar to the baseline as the budgets for Basic services and Leader remain status quo.
3.2.3.3. SO3 Addressing territorial imbalances, rural poverty and social inclusion
This SO focuses on the 'fairness or equity part' of the policy, in addition to the OO on Providing income support in a targeted way, by investigating whether the distribution of support is able to close gaps between territories, including rural versus urban, and different groups, such as youth or women, within these territories. The modelling tools do not provide much insight, as they still lack necessary data and have difficulties to depict the effects of RD measures well. A recent study of the World Bank shows the beneficial effects of the current CAP towards poverty reduction, with a main role played by the direct decoupled support complemented by the RD payments. Similar to the previous SO, option 5 is generally perceived as the most fair, with its redistribution towards small farms, YF top up, ANC payments in pillar 1, and high budgets for Leader and basic infrastructure and services. Option 3b follows by a distance.
Following OOs are part of this SO:
·OO3.1: Reduce inequalities between territories
·OO3.2: Reduce inequalities between groups
·OO3.3: Improve social capital and networks
·OO3.4: Contribute to healthier lifestyles
This last OO contributes to the cross-cutting objective of addressing societal expectations on food and health and does not only relate to rural areas. With a weight of 34% towards this SO it is perceived as most important. The other 3 OOs have a similar weight of around 20%.
|
Table 3.7. Option scores for SO3 on territorial imbalances and rural poverty and its 4 OOs
|
Graph 3.15. Option scores on SO3
|
|
|
|
Regarding reducing inequalities between territories (OO3.1), no exact figures are available regarding the rural versus urban divide. From the modelling exercise we however know that farmers' income in general is deteriorating compared to the baseline, given the budget cut, the redistribution and increased environmental and climate ambition in the options. As a consequence, the current gap between farmers' income and the average wage in the economy is not expected to close further, on the contrary. Between territories in rural areas, the section on Less Favoured Areas (LFA currently named Areas with Natural Constraints – ANC) in the modelling part is informative. The expert judgement is complemented with modelling results on farmers' income in LFA and the ratio between income in LFA versus non-LFA (equal weight, see graph 3.16). The experts acknowledge the important role of basic services and Leader to help rural areas to catch up, with Leader working better in dynamic areas. They also share a concern that a delivery model with more flexibility for MS might lead to increasing disparities between MS territories as some MS might notably decide to further enforce some specific interventions in some regions while others may not. Concerns related to the probable absence of minimum regulatory spending were also been expressed; according to the experts, without such an obligation, MS would devote the biggest part of their budget to agriculture and not to rural services and other rural actions. Experts rank option 4 first as it contains redistribution towards permanent grassland (associated with lowest income) and VCS for extensive livestock (idem). Option 5 follows with the redistribution towards small, ANC for mountainous areas in pillar 1, the top-up for permanent grassland, VCS, enhanced support for basic services and Leader. The experts would rank the baseline with its higher budget higher, as it helps to close the rural-urban divide, but it lacks targeting compared to the other options. 3a ranks lowest as it does not distinguish between territories with a flat rate and no VCS. The expert judgement is largely in line with the modelling results, except for option 4 where the experts were too positive. Option 5 scores best on the ratio between income in LFA compared to non-LFA, so it's closing the relative income gap most, while the baseline has the highest income level in LFA, but it is still much lower compared to non-LFA.
Graph 3.16. Option scores on indicators associated with OO3.1 Reducing inequalities between territories
For reducing inequalities between groups (OO3.2), following vulnerable groups are distinguished: youth, women, elderly people, Roma people and migrants. While several tools in the 1st pillar target inequalities among farmers (such as redistributive payment, risk management tools, POs, support for young farmers, investment support), for rural dwellers in general only 2nd pillar payments are relevant (such as support for basic services, diversification, SMEs, Leader, ANC, knowledge development). Leader is the only instrument which currently can specifically target the most vulnerable groups cited above (with exception of young farmers' payment). Option 5 gains the highest ranking with the low minimum requirements, the targeting of small farmers, ANC in the 1st pillar, high expenditure for Leader and basic services, high EIP, YF payment, VCS etc. It is followed by 3b which also has a high expenditure for Leader and VCS as well as redistribution. Option 4 receives a lower score as expenditure on Leader is lower. Positive for 4 is the targeting towards extensive livestock farms, which tend to have lower incomes. The baseline and option 1 are ranked last given lower targeting and budget for Leader.
The following OO3.3, improving social capital and governance in rural areas, focuses on the virtues brought by stronger ties between rural dwellers but also between rural and urban citizens, as this stimulates the rural attractiveness and improves the social resilience. Local governance is also seen as positive, leading to stronger ties and trust between decision makers and beneficiaries. The main contributions from the CAP come from the investment in knowledge transfer and cooperation (under RD measure 1, 2 and 16), Leader, POs and networks such as the National rural Networks and EIPs. Regarding governance, a delivery model which is more geared towards addressing local needs is expected to enhance acceptability and trust by the end beneficiaries. Option 5 is ranked highest as the focus on small, together with higher EIP and Leader, will stimulate cooperation. Option 3a also ranks high with high spending on EIP, cooperation and innovation. The rest of the options are less favourable in stimulating networking.
Agriculture is the first link in the food chain and an important contributor to health through the nutritional quality of food and its adequate supply. Regarding OO3.4 on contributing to healthier lifestyles, the experts stressed the importance of basic services for public health. They also see innovation as important to produce healthier products. Environmental aspects can also have an impact on health, as illustrated by AECH measures on antimicrobial resistance. VCS could be targeted to support healthier products and quality schemes instead of to vulnerable sectors. The experts do not see a clear link between farm size and product quality. Lastly, research on the link between organic products and health is also still inconclusive. Option 5 is ranked best given the large budget for AECH, basic services, the support for direct sales and the top-ups for organic. 3b also scores high given the high support for basic services and competitiveness, as well as Leader, although with lower EIP. 3a receives an equal score, given high EIP and Eco-scheme.
3.2.4.Environmental and Climate Policy Objective: Bolstering environmental care and climate action and contribute to the environmental and climate objectives of the EU
The environmental policy objective combines efforts towards mitigating and adapting to climate change with those contributing to care for soil, water, air and biodiversity, as well as valued landscapes. All options are geared towards improving the contribution towards the environmental and climate objective, with basic conditionality going beyond the current GAEC and cross compliance, complemented with additional environmental requirements. This is also reflected in the MCA-scores where the options outperform the baseline and the baseline with cuts (graph 3.17). Option 5 sets aside 30% of direct payment envelopes for environmental top-up payments (in relation to organic farming, permanent grassland, landscape features and ANCs). It complements this with an increased budget for AECH. Options 3a and 4a test subsidiarity and start from the premise that MS are willing to step up their environmental ambition, while options 3b and 4b reflect more conservative choices by MS. Option 3 tests the approach of an eco-scheme under pillar 1, which is an incentive based approach where farmers can engage on a voluntary basis. Option 4 on the contrary tests a conditional approach, with environmental requirements an integral part of the requirements to receive direct payments. Both approaches start from a needs assessment at MS or even regional level to identify the most appropriate measures.
|
Table 3.8. Option scores for the Environmental Policy Objective and its 3 SOs
|
Graph 3.17. Option scores on Environmental Policy Objective
|
|
|
|
As table 3.8 shows, options 3a and 4a are judged best and gain a comparable score, while option 5 follows at a short distance. However, as there is considerable uncertainty regarding the level of ambition of MS, a strong fall back can be noted when considering the more conservative versions (options 3b and 4b) of these options. This is more amplified for option 3 compared to option 4. Under uncertainty of MS choices, an approach based on conditionality seems to be more effective, as it assures engagements of all farmers, is easier to control and avoids budget swings and a mismatch between farmers' efforts and the granted incentive. Typically under an eco-scheme those already performing well will sign up, while the laggards will refrain from engaging, unless the provided incentive is high enough (but this will cause budget overshoot). In order to avoid conservative choices by MS, additional safeguards, in the form of target setting, EU requirements or possible budget earmarking, will have to be pursued.
A second important observation relates to the focus of eco-schemes versus enhanced conditionality. Experts judge an eco-scheme to be more effective in the case of hot spot problems, while enhanced conditionality could perform better if there is no strong regulation in place (e.g. for soil) or if the issue is of widespread concern (e.g. climate change). As enhanced conditionality needs to apply to all farmers concerned, it will be necessarily less demanding/targeted compared to the eco-scheme.
3.2.4.1. SO1: Contribute to climate change mitigation and adaptation
Climate change is an important EU priority and the CAP is expected to contribute to the EU climate objectives by directing the farming community towards greater efforts for both mitigation and adaptation. The MCA analysis shows that the mix of policy instruments proposed in option 5 performs best to contribute to mitigation and adaptation. This mix includes among others a top-up for permanent grassland and organic farming, a large budget for AECH, VCS for extensive livestock only and high spending on EIP. Option 4 is slightly preferred over option 3, indicating that conditionality, applying to all farmers, is preferred over a voluntary eco-scheme. Main reasoning is that climate change is not location-specific and affects all, so joint measures are necessary. The experts judge the variation between the sub-options a and b quite large. In fact, option 4a with its enhanced eco-conditionality scheme is the preferred option. But, as can be seen from the considerably lower score of option 4b, experts question whether a delivery model with increased subsidiarity needs additional safeguards to guarantee high ambition from MS. In a similar sense, option 3a with its voluntary and ambitious eco-scheme also performs well, as opposed to 3b. All options outperform the baseline with cuts.
To make this SO more concrete, 3 OOs were identified:
·OO1.1: Prevent/reduce greenhouse gas (GHG) emissions
·OO1.2: Increase carbon storage
·OO1.3: Enhance farms adaptation capacity
|
Table 3.9. Option scores for SO1 on climate change adaptation and mitigation and its 3 OOs
|
Graph 3.18. Option scores on SO1
|
|
|
|
In 2015 agricultural GHG emissions (OO1.1) in the EU-28 amounted to 437 million tonnes of CO2 equivalents, 10.1% of total emissions for that year. The long term trend of GHG emissions shows that emissions decreased, with a slowdown in the last years. Main sources of GHG emissions are enteric fermentation of ruminants, manure management, rice cultivation and agricultural soil management. Cropland is generally considered a source of GHG emission, while grassland is considered on average a sink for CO2. To compare the options, the number of livestock and the fertiliser use are leading factors. For this OO, experts rank 3a first, as the large envelope for eco-schemes allows granting incentives targeting emission reductions and with VCS absent, no additional production stimuli are given to sectors which contribute to GHG emissions (especially cattle). 4a and 5 follow as the beneficial measures there are more relevant for soil carbon storage. 4b scores lower as the environmental ambition is considerably lower. On top of its low environmental ambition, option 3b allows granting VCS to all cattle, explaining its low score. The CAPRI modelling results were also accounted for in the MCA to complement the expert judgement (with an equal weight, see graph 3.19). The expert judgements and model results are fully in tune for options 3b, 4 and 5, while for option 3a experts were more positive compared to the modelling as they did not fully account for emission leakage higher in option 3a than in option 4a. Emissions leakage is due to higher beef imports to compensate for the decline in beef herd linked to the suppression of VCS.
Graph 3.19. Option scores on indicators associated with OO1.1 Greenhouse Gas Emissions
Regarding soil carbon storage (OO1.2), CO2 emissions from the conversion or the implementation of certain farming practices are declining but represent still 60Mt CO2/year. The main cause is the conversion from grassland to cropland, leading to a decline in soil organic carbon. The group experts have a preference for option 4a given the redistribution of DP in favour of permanent grassland, which is associated positively with carbon storage, and other measures such as winter soil cover. Option 5 also scores high as it contains top-ups for permanent grassland, landscape features and organic farming. Option 3a follows, among others due to the beneficial effects of the eco-scheme measure of winter soil cover on arable land. Option 4b also receives a positive score given the redistribution of DP towards permanent grassland. The basic conditionality in the options imposes a ban on ploughing of wet and peatlands, which is favourable for retaining carbon in the soil. The baseline and option 1 are hence seen as overall less ambitious towards increasing soil carbon storage.
Agriculture is highly vulnerable to climate change, so climate change adaptation (OO1.3) is considered an important priority. Impacts are highly place and crop specific. Option 3a is preferred as it contains the eco-scheme, worth 60% of DP, which allows targeted interventions and it has a high budget for risk management (10% of DP). Option 5 also scores high given the largest budget for AECH while also landscape features, for which a top-up to the DP is granted, help to build up resilience. 4a also scores reasonable well as the enhanced conditionality improves resilience, but the cut in RD payments for competitiveness is seen as negative.
3.2.4.2. SO2: Foster sustainable and efficient management of resources
This second environmental specific objective groups the bulk of environmental objectives of the CAP – including elements related to soil, water, air, pesticides and antibiotics, and agricultural genetic resources. Option 5 targets 30% of the DP envelope to top ups for permanent grassland, organic farming, ANC in mountainous areas and landscape elements. Option 5 also contains a large budget for AECH. Under the assumption of ambitious environmental choices by MS, option 3a and 4a outperform option 5 on this SO. When MS take a more conservative stance (option 3b and 4b), the environmental performance drops back significantly. But, given the increased basic conditionality, among others with simple crop rotation and non-productive areas, all options outperform the baseline and the baseline with cuts.
|
Table 3.10. Option scores for SO2 on sustainable management of resources and its 4 OOs
|
Graph 3.20. Option scores on SO2
|
|
|
|
For improving soil condition (OO2.1) both measures to increase the soil organic content and to reduce soil erosion are important. Some measures are already part of the current GAEC. In absence of an EU wide soil legislation, the experts see more virtue in a policy with enhanced conditionality, as it puts a lower boundary for all and assures large coverage, compared to a policy which targets hot spots via an incentive based eco-scheme. This enhanced conditionality could for example include winter cover crops and permanent cover. Because of this, but also because of the support for permanent grassland and extensive livestock, option 4a is preferred, followed by both 3a and 5. Option 5 has a large AECH budget and a top-up for permanent grassland. 3a allows targeting the real hot spots. The rest of the options have lower environmental ambition.
For reducing air pollution (OO2.2), ammonia emissions are the biggest concern. Agricultural activities in the EU-28 resulted in the emission of 3.7 million tonnes of ammonia in 2014 (EEA) or 94% of total ammonia emissions. The number of livestock animals is one of the main drivers of ammonia emissions, which originate from animal feed and manure. In addition, ammonia emissions may also occur from urea and ammonia based fertilizer application. Measures with impact on emissions are manure injection/animal feeding strategies, better stables and nitrogen use improvement. Unlike GHG, for ammonia it matters where emissions originate: reduction of intensive to extensive is important. Experts note that directing more support to permanent grassland (Option 4 and 5) can give indirect support to the livestock sector, increasing emissions. Also important is that for pig and poultry farmers there is little impact of DP, for them pillar II measures are more relevant. The ammonia emissions for the different options could be obtained from the modelling exercise. The resulting scoring (see graph 3.21) is very similar to the one obtained from the group expert judgement. 3a is the preferred option as the eco-scheme allows targeting the hotspots, while there is no VCS. 4a scores 2nd, due to the enhanced conditionality, although the redistribution to permanent grassland might give an incentive to livestock production. Option 5 also scores well, with its large AECH budget and the top-up for organic farms (which have better nitrogen balances), although the focus on small farms, which have fewer means to invest in different housing conditions (important for ammonia emissions), counts negatively. 4b scores better than 3b because of higher EIP.
Graph 3.21. Option scores on indicators associated with OO2.2 Reducing air pollution
The third OO focuses on improving water quality and use. Water quality can be linked to the gross nutrient balance and pesticide use while water use mainly links to water exploitation by agriculture compared to water availability, mainly through irrigation. The pressure from agriculture on water quality is decreasing, although not uniformly. In 2012, it was estimated that, despite reductions in agricultural inputs, diffuse pollution from agriculture is a significant pressure in more than 40% of rivers and coastal waters. The share of agriculture in EU water abstraction (24%) has wide variations (in Southern countries it is 65%), but water abstraction is generally declining. All options contain a nutrient management plan (although how it will be implemented was not specified for the qualitative exercise). Water abstraction problems are mainly relevant for the South. According to experts, 3a receives the best ranking as it allows to targeting at river basin level, closely followed by 4a as it can assure agriculture wide coverage. 5 scores lower as pillar 1 measures are not specifically targeting water, although beneficial effects might be expected from top-ups targeting organic farms (e.g. limiting pollution from pesticides) and landscape elements (e.g. limiting leaching). The high budget for AECH allows to also cover water related measures. 3b is ranked higher than 4b because the light eco-scheme might contain measures relevant for water. Measures for nitrate leaching from the modelling are also accounted for in the MCA. Expert judgements on this OO and modelling results are closely in line (Graph 3.22).
Graph 3.22. Option scores on indicators associated with OO2.3 Improve water quality/use
The sustainable use of pesticides and antibiotics (OO2.4), an objective which also contributes to the cross-cutting objective of societal expectations on food and health, largely depends on legislations implemented independently from the CAP. Hence the core impact is the result of requirements imposed from legislations relating to health and environment. However it is clear that agriculture is a major user of pesticides and antimicrobials. The CAP has currently and in the envisaged future instruments relevant for improving the use of these substances. The group experts see an important role for training (FAS) and EIP. For Integrated Pest Management (IPM), a systems approach is desirable (including training, advice, forecasting etc.). Antimicrobial resistance (AMR) is mainly an issue for intensive farming. With pig and poultry farms hardly getting direct payments, targeting might work better through AECH compared to the eco-scheme under pillar 1. 3a and 5 are considered the preferred options. 3a allows targeting and offers a layered approach with basic conditionality, an eco-scheme and AECH payments on top of that, while 5 has a large budget for AECH and a top-up for organic. In option 5 large intensive farms where pesticides are potentially more an issue, might escape. In that sense option 4a with enhanced conditionality could perform better. 4b scores higher than 3b as it offers a larger budget for EIP.
For the preservation of agricultural genetic resources (OO2.5), AECH measures (currently submeasure M10.2 on conservation of genetic resources, M10.1 on rare breeds and M11 organic) are most relevant. Support connected to the EIP and the development of niche supply chains is also important. Experts make the assumption that the eco-scheme will probably not contain measures targeting this OO. Option 5 is ranked best thanks to its high budgets for AECH and EIP as well as its organic top-up. It is followed by option 4. Option 3 and the baseline have a similar score given EIP and AECH budget versus the budget cut.
3.2.4.3. SO3: Preserve nature and landscapes
This SO focuses on improving farm and forest biodiversity (OO3.1) as well as maintaining/improving culturally valued landscapes (OO3.2). Option 3a outperforms the rest, but the spread with option 3b is wide again, so it will depend on MS ambition. Option 5 also performs well.
Due to the millennia-long interaction between farming and the environment, specific habitats and species have developed that can only be maintained by the continuation of farming. Nearly half of the habitats linked to agricultural ecosystems are in an unfavourable conservation status (EEA, 2015). Main threats to agricultural biodiversity-rich environments are land abandonment, which under European conditions would mostly lead to shrub encroachment, and intensification, which leads to the simplification of plant and animal communities. For improving farm and forest biodiversity option 3a ranks best according to the experts, due to the ambitious eco-scheme which allows including targeted measures for biodiversity. However, there was discussion whether for biodiversity improvement you need a more regional approach, which would favour enhanced conditionality (option 4a). Option 5 also scores high, as it stimulates organic farming, permanent grassland and landscape features through top-ups, while also containing a high budget for AECH. 4b scores lower as it has only basic conditionality, although the redistribution towards permanent grassland and VCS for extensive livestock might contribute positively. 3b also scores lower with the smaller eco-scheme.
For the maintenance/improvement of culturally valued landscapes, Natura 2000 legislation is important. Option 3a scores best according to the experts as the eco-scheme combines high ambition with the possibility to target aid to relevant measures. 4a also performs well due to the additional support for permanent grassland and VCS for extensive livestock, which are associated with culturally valued landscapes, on top of its enhanced conditionality. Option 5 ranks lower than 3a and 4a, as it concentrates support on areas where cultural landscapes already exist thus helping maintenance. However, accounting for the uncertainty in options 3 and 4 implementation, option 5 scores as good as the average of these options. An additional risk, which was not accounted for by experts is the risk of further land consolidation in option 3a if not specific measures are implemented to keep/improve culturally valued landscapes.
|
Table 3.11. Option scores for the SO3 on nature and landscape preservation and its 2 OOs
|
Graph 3.23. Option scores on SO3
|
|
|
|
3.3.Efficiency of the policy options: simplification
This section recapitulates the option scores derived from the group expert judgement on simplification. To get a full overview of the Simplification objective, it should be read in complement to the Annex on Simplification accompanying the IA report (see Annex 7). For the cross-cutting objective on simplification, a single specific objective is identified.
3.3.1.SO1: Streamline CAP design and delivery on relevant EU objectives, including simplification
As shown in Graph 3.24, the baseline and option 1 are seen as bringing little to no simplification. A significant gap occurs with all other options, driven by the shift towards performance and the common potential administrative burden reduction stemming from the streamlined CAP plans.
This SO considers the following 3 OOs:
·OO1.1: Shift from compliance to performance
·OO1.2: Reduce the administrative burden
·OO1.3: Enhance the proportionality of administrative costs
OO1.1 looks at whether the CAP design and delivery under the options facilitates and incentivises performance. The group weighting attributed a high importance to this OO with 45%. Alternative options to the baseline and option 1 are considered to trigger results more effectively. Key argument put forward is the flexibility given to Member States under the new delivery model to focus the CAP interventions on identified national and regional needs. Options 4a and 4b score best with more certainty on performance linked to the conditionality, while results under 3a and 3b are dependent on the uptake of the eco-scheme by farmers. The lower scores for options 3b and 5 are explained by the limitations in the design to focus on needs, i.e. the use of entitlements under option 3b and prescriptive approach under option 5.
|
Table 3.12. Option scores for Simplification and its 3 OOs
|
Graph 3.24. Option scores on SO1
|
|
|
|
The assessment of the potential administrative burden reduction under OO1.2 revealed that administrative burden is closely linked to the complexity of the CAP design and delivery, in terms of variety in tools and choices of complex tools, as well as to the ambition. A more complex strategy will require more time for set-up and implementation by administrations and set higher burden on beneficiaries for payment applications and controls. More ambitious strategies in terms of environmental requirements likewise increase administrative burden. Under this mind set, option 4b proposes a reasonable set of tools (basic payment and limited VCS) while remaining conservative on the conditionality. Option 4b is followed by option 3a (flat rate, no VCS, but with an eco-scheme) and option 4a (higher environmental requirements). The use of entitlements and multiple VCS are the reason behind the lower score for option 3b, while for option 5 it is the prescriptive approach and the variety of tools (VCS, redistributive payments). The baseline and option 1 score lowest as these options do not benefit from gains in administrative burden deriving from the streamlined CAP plans.
OO1.3 assesses the efficiency or "value for money" of the options. It combines the assessment of the administrative burden with the results from the analysis of the effectiveness of options. For option 5, the low score on OO1.2 on administrative burden is counterbalanced by the high effectiveness associated. It scores equally with option 3a, with lower score for effectiveness associated with lower administrative burden. The baseline scores lower due to the higher administrative burden and the lower effectiveness, while option 1 scores the lowest as it combines the lowest effectiveness with proportionately higher administrative burden than the baseline (due to the budget cut).
3.4.Promoting knowledge and innovation in agriculture and rural areas: Modernisation
This section presents the option scores derived from the group expert judgement on modernisation. To get a full overview of the Modernisation objective, it should be read in complement to the Annex on Modernisation accompanying the IA report (see Annex 6). For the cross-cutting objective on modernisation, i.e. promote knowledge and innovation in agriculture and rural areas, a single specific objective is identified.
3.4.1.SO1: Co-creating innovation and sharing knowledge, including across generations
As shown in Graph 3.25, all options score significantly better than the baseline and especially the baseline with cuts. Experts consider that most impact on this objective is to be expected from the EIP-budget, which is significantly increased in the alternative options. Other instruments will only have secondary effects. Option 3b scores lower as it is the option where the EIP-budget increases less.
This SO considers the following 4 OOs:
·Enhancing Agricultural Knowledge and Innovation Systems (AKIS) and strengthening links with research
·Strengthening of farm advisory services within the AKIS
·Enhancing interactive innovation
·Supporting digital transition in agriculture
Experts consider the first OO on enhancing AKIS the most important in contributing to the SO with a weight of 36%. The budget allocated to knowledge and innovation is considered the main driving factor. Whether the option contributes to an enabling environment is also considered important. Uncertainties relate to small farms and young farmers. Small farms are associated with part-time farmers and those might be less interest to apply the latest innovations. Experts consider that young farmers are more prone to engage in innovative activities. Older farmers, in absence of a successor for the farm, are less likely to invest in the latest technology. Young farmers are also more interested in adding value activities such as organics. Their farms are also not necessarily smaller than those of older farmers. Options 3a and 5 attain the highest ranking as both have a high budget for knowledge and innovation and their strong focus on young farmers. Option 4 ranks a bit lower as there is less focus on young farmers. Option 3 has a lower budget for knowledge and innovation (but still exceeding the baseline) and young farmers are not specifically targeted, so it ranks lower.
The 2nd OO focuses on strengthening of farm advisory services within the AKIS. The current legal framework obliges MS to have a Farm Advisory System (FAS) in place. However, the use and uptake of the knowledge and advice measures remains limited in the current programming period. The efficiency and effectiveness of advisory services can best be upgraded by improving their connections within the AKIS. Main elements to consider for this OO are the EIP budget, the competitiveness measures, the focus on young farmers and new entrants, LEADER and basic services. Another point is that more environmental ambition requires more advice services. There was consensus in the group that options 3a, 4 and 5 are considered equal, as all farmers need advice equally and the budget for knowledge and innovation is the same. 3b was therefore also judged lower.
|
Table 3.13. Option scores for Modernization and its 4 OOs
|
Graph 3.25. Option scores for Modernisation
|
|
|
|
The 3rd OO focuses on the enhancement of interactive innovation projects. To enable impact from projects, the basic concept of the EIP-AGRI is to focus on end-users’ problems/opportunities and to have partners with complementary types of knowledge joining forces in project activities from the beginning till the end. This is called the 'interactive innovation model' and is essential to tackle current complex and systemic challenges with good results. As this OO is very much linked to advisory services, although its focus rests upon joint projects, its ranking follows the same line as OO1.2.
The 4th OO of supporting digital transition in agriculture receives a lower weight compared to the other 3 as here other influences (e.g. developments by private providers of digital tools and services) beyond the CAP are also very important. Information technologies increase the availability of information for man and machine to make better decisions. In doing so, digital technologies have the potential to improve the performance of agriculture in economic, social and environmental terms. Main element to consider is the budget for EIP and competitiveness, although also the overall enabling environment affects the digitalisation process. Infrastructure has a major impact, especially access to broadband. The experts acknowledge that the digital transformation has also negative effects, such as the loss of jobs. However, jobs are created as well. Regarding options, 3a ranks best as it has a high budget on EIP and competitiveness as well as support for young farmers. Option 5 follows as it has a high budget on EIP and competitiveness and support for young farmers, as well as the highest budget for basic services in rural areas. However, the focus rests on small farmers who are perhaps less prone to investing in digitalisation. Given its high budget for EIP and competitiveness, but less focus on young farmers, option 4 scores a bit lower. 3b has a higher spending on basic services and infrastructure and competitiveness but lower EIP so its final ranking is judged lower, still outperforming the baseline.
3.5.Policy coherence
3.5.1.EU priorities
The CAP is already relevant to many EU priorities, and must continue to contribute to as many as possible. The key priorities to which it can probably make the greatest contribution are those on Jobs, growth and investment; Energy Union and climate action; a Stronger Global Actor; the Digital Single Market and Migration. Modernising and simplifying the CAP will maximise its contribution to the ten priorities, develop more synergies and make it more coherent with other EU policies.
3.5.2.Policy coherence for development
As the current one, the future CAP should continue to be aligned with the commitments of the EU on Policy Coherence for Development (PCD), as outlined in the Treaty of the European Union (Articles 3 and 21) and the Treaty of the Functioning of the European Union (Article 208). This means that the impacts of the CAP should not counteract the development policy objectives of the EU. The new CAP will take into consideration the Sustainable Development Goals (SDGs) and it will therefore consider the concerns that are relevant for Policy Coherence for Development, such as food security, poverty and equality. In this chapter we first describe the alignment of the current CAP with PCD and complement with observations on the tested policy options.
Trade
Food security is one of the key objectives of the CAP, both within the EU and globally. Globally, the EU promotes multilateralism, by advocating open, rules based trade. The EU has given long-standing preferential market access for products from developing and least developed countries (LDCs) and this access has been substantially deepened over time. Under the 'Everything But Arms' Initiative, LDCs are given duty- and quota-free access to the EU market. Under the Economic Partnership Agreements (EPAs), African, Caribbean and Pacific countries enjoy full duty- and quota-free access for their products to the EU market. The EPAs also leave partner countries sufficient policy space to enhance their agricultural production and to strive to eradicate poverty. To help with this, the EU applies asymmetry to market access, allowing almost all agricultural products, including full agri-food sub-sectors that are strategic for the partner states, to be excluded from liberalisation or protected by safeguards. As a result, the EU remains, by far, the world's largest importer of agricultural products from Least Developed Countries (LDCs), €3.5 billion worth agri-food imports from LDCs in 2017, compared with € 2.7 billion by US, Russia, Japan, China and Canada together.
Development cooperation
The EU is committed to helping developing countries integrate their agricultural sectors into the world’s trading system and share in the benefits of the global economy. Food security and nutrition remain at the centre of EU's development programmes. From 2014 until 2020, the EU budget has allocated more than € 8.5 billion for food security, nutrition and sustainable agriculture in 62 partner countries, of which 36 countries in Sub-Saharan Africa. In addition, the EU promotes quality policy in developing countries, for example supporting the development of Geographical Indications in Africa in order to add value to African agri-food production, and recognising the organic production in more and more developing countries. EU-funded research and innovation programs also can benefit developing countries, notably via participation in Horizon 2020 etc.
But development support and trade need to be complemented by policies to promote responsible private sector investment in developing countries, especially in Africa. The EU has launched a policy dialogue with several layers with its African Union partners. The EU's experience can be used to further develop employment opportunities in agriculture and rural areas, in an open dialogue with the EU's partners.
CAP
The Common Agricultural Policy and agricultural trade policy continue to align closely with development policy. Over the past 25 years, the CAP has undergone successive reforms which have increased its market orientation and removed its trade distorting features, eliminated export subsidies, eliminated or reduced to safety net levels market support prices, and decoupled direct payments from production. The reforms consolidated the long-term trend towards direct income support for farmers, a form of public investment, as opposed to more trade-distorting forms of support, improving the sustainability of the policy.
Minimising market distortion
A major change to the CAP over the past twenty years has been the movement away from coupled support, which was tied directly to the production of particular products. The CAP reformed from supporting products to supporting producers, breaking the link between subsidies and production. Currently, over 90% of direct support does not distort trade – it is decoupled from production. EU support to farmers is made conditional on compliance with a number of environmental and social standards and practices, which are among the highest in the world, and which are usually not remunerated by the market. It responds to the policy objectives and also responds to the legitimate expectations of consumers in Europe and abroad on quality, safety, diversity and added value.
Furthermore, it is very difficult to associate the export price to the level of support received by the producer of a primary product. Prices of exported products – in the case of the EU, most of them being processed products, develop as a result of multiple factors which affect the competitiveness of the exporting industry. Effect of the support to the producer of the primary product is marginal, as it is largely decoupled from the volume and type of production and will not affect the production decision.
Stopping use of export subsidies
EU public funds are no longer used to subsidise exports outside the EU, which avoids distortions to the local markets.
For the last two decades the systematic use of export refunds (a form of subsidy designed to bridge the gap between higher EU prices and lower world prices) has gradually decreased. Today all rates are set at zero and, since July 2013, export refunds have ceased to exist as a means of systematic support. CAP was previously heavily criticized because of the negative effects on developing counties of its export subsidies. If in 1993, the CAP spent more than €10 billion on export subsidies; in 2012 the expenditure on export refunds was no more than €147 million. Since July 2013, no agricultural sector has benefited from these. In January 2014 the Commission went a step further, legally committing the EU not to grant export refunds for all products exported to African countries entering into a full Economic Partnership Agreement (EPA) with the EU. The EU was also a driving force behind the WTO Ministerial Decision in December 2015 to eliminate all export subsidies and discipline other export measures with similar effects.
Exceptional use of market measures
Market measures are still permitted, but only in the case of crisis, and in that case price support for farmers is set at levels that are generally well below normal market conditions, reducing EU surpluses and bringing EU prices more into line with global prices.
3.5.3.What do the options bring towards PCD and the EU's WTO engagements?
To analyse the effect of the options on coherence, it is also necessary to describe the potentially distorting impact of the most relevant instruments. Within the set of tested CAP instruments, the following ones are most associated with impact on third countries:
·Decoupled direct support
·Coupled support
·Risk management tools
·Payments for management commitments, in casu the incentive-based eco-scheme
·Sectorial programmes: market measures
Decoupled direct support is not considered trade or production distorting under WTO and hence any changes in those are not expected to affect third countries. The propositions made in option 4 to increase direct support for permanent grassland at the expense of cropland would still fall under the eligibility criteria of WTO Green Box to the extent that no production is required to receive the support.
The 2013 CAP reform has allowed some degree of recoupling of direct payments. Coupled payments have the intention to maintain production at current levels or bring it back to historical levels, so there is a positive impact on production associated. Estimates are roughly that EUR 2-4 billion of support could no longer be eligible to Green Box as a result (VCS is currently notified as Blue Box but would likely become Amber Box in the future). Recent changes were made in the Agricultural Omnibus to clarify the applicable rules. Within a Total Aggregate Measurement of Support (TAMS) ceiling of EUR 72 billion, and even accounting for the recent increase in coupled payments and sector-specific risk management tools, there is still enough margin for the EU under the WTO Agriculture Agreement. VCS with large flexibility and budget (maximum 15% of DP) is tested in option 3b. VCS for extensive livestock and protein crops for 10% of DP is tested in option 5, while option 4 contains only VCS for extensive livestock (3.5% of DP).
The changes introduced in the Agricultural Omnibus for risk management tools will give farmers a better protection in case of production risks. A sector-specific income stabilization tool covering drops in farmer's income exceeding at least 20% has been introduced. Furthermore, the threshold for insurances has been reduced from 30% to 20% of the average annual production, making these instruments more accessible to farmers. The support rate for crop, animal, and plant insurance, mutual funds and income stabilisation tools has been increased from 65% to 70%. However, those changes partly move the risk management tools from Green to Amber Box (i.e. sector-specific tools, or those with an income drop of less than 30%). In the options a risk management budget of 5% of the DP envelope is tested in options 3b and 4 and of 10% in option 3a, which is a considerable increase compared to the current budget allocation.
For the eco-scheme, as part of the direct payments, the WTO rules can be seen as a constraint because the Green Box criteria limits payments to covering only the observed extra costs imposed by the required environmental effort. However, it remains extremely difficult to calculate the exact amounts of cost incurred – income foregone and hence make a distinction between 'incentive' and 'compensation'. Finally, WTO classification of ecological schemes depend whether such schemes would be notified as a separate scheme or part of the direct payments envelope (often referred to as "greening"). An ambitious eco-scheme (for 60% of DP) is tested in option 3a and a more conservative one (for 30%) in option 3b. It should be noted that the purpose of eco-schemes is not to enhance production but to enhance delivery on environmental objectives. The effect of these schemes is therefore most likely to provide a production constraint or to have a certain influence on the type of production chosen rather than an overall production stimulating effect.
Market measures, as referred to in the previous section, are only triggered in real crisis situations and the associated intervention prices are set at low level far from normal levels of world commodity prices, hence they do not create significant distortion. However, from the WTO perspective these measures qualify as Amber Box support, including market price support (MPS). MPS is notified to the WTO by multiplying the gap between the intervention price and external reference price by the eligible production. Nevertheless, no changes are tested throughout the options.
The effect of the different instruments can be summarized in following table:
Table 3.14 Production distortive effect of policy interventions
|
Policy intervention
|
Distortive effect?
|
Present in option? (importance between brackets)
|
|
Decoupled direct support
|
0
|
All
|
|
Coupled support
|
--
|
3b (large), 4 (small) , 5 (medium)
|
|
Risk management tools
|
-
|
3a (large), 3b, 4 (medium)
|
|
Eco-scheme
|
0/-
|
3a (large), 3b (medium)
|
|
Market measures
|
0/-
|
All
|
Based on this simple analysis, one could conclude that option 3b has the most features with potential to distort production and influence trade with external partners, as it has most VCS, a considerable risk management budget (with sector based IST and lowered thresholds) and an eco-scheme. Depending how the eco-scheme would be perceived (distortive or not), 3a would be more or less distortive, as in this option the eco-scheme counts for 60% of DP and another 10% for risk management. Options 4 and 5 are similarly less distortive, with option 4 having more risk management but less VCS compared to 5.
3.6.Cross cutting: Improving sustainable development for farming, food and rural areas
3.6.1.Address societal expectations on food and health
As indicated during the public consultation and in the Communication on the Future of food and farming, the CAP is expected to respond better to citizen demands on food and health. Societal expectations on food and health stretch over various components of sustainable food systems such as:
·food safety and quality
·affordability of food (also one of the cornerstones of art 39 of TFEU)
·health issues such as pesticide load and antimicrobial resistance
·food waste and agricultural losses
·responding and anticipating to changing demands
They are covered across the different operational objectives against which the different options are tested. Food safety, as enshrined in EU legislation, is a condition sine qua non for each option. The economic OO 2.3 on Adding value to agricultural products is particularly relevant for food quality (with its link to organic, GIs and certification schemes), but also for food waste reduction through the link with bio-economy and circular economy. Food waste can also be reduced through economic OO 3.2 on enhancing synergies within the value chain, by means of increased transparency and information exchange along the chain. Agricultural losses can further be reduced through OO 2.1 on efficiency gains and 2.2 on Demand driven production models. The affordability of food is specifically tackled under economic OO demand-driven production models, focusing among others on further reducing the gap between EU and world prices. Social OO 3.4 is directly measuring agriculture's contribution to healthier lifestyles, while environmental OO 2.4 on sustainable use of pesticides and antibiotics tackles related citizen concerns. Responding to changing consumer demands is directly related to economic OO 2.2 on demand driven production models and OO 3.3 on development of alternative value chains such as short supply chains, directly connecting farmers with consumers.
Graph 3.26 summarizes how the different options score on these operational objectives. We refer to the respective sections on OO to better understand why the options score differently. The 3 alternative options outperform the baseline and especially the baseline with cuts (with the exception of the OO on demand driven production models, as prices are expected to be lower in the baseline). Option 5 performs well on some issues, such as alternative value chains, healthier lifestyles and sustainable use of pesticides and antibiotics, but it underperforms on several other (economic) objectives. Option 4 also combines high scores on some objectives with lower scores on others. Option 3 reaches more balanced scores, but in general lower than 5 or 4.
Graph 3.26. Option scores for Citizen expectations on food and health
Graph 3.27. Scores of options 3a, b and 4a, b for Citizen expectations on food and health
Considering the sub-options of 3 and 4 confirm the better score of the eco-scheme based option 3a on several objectives, as well as the better score of option 4b on some economic objectives, as it is less (environmentally) demanding compared to the others.
In a budget constraint environment, necessary trade-offs have to be made between the various available instruments. The main trade-off relates to the price versus additional quality and health attributes. The (sub-) options scoring better on price and economic efficiency underperform with respect to contributing to healthier lifestyles and sustainable use of pesticides and antibiotics. So in essence it boils down to the policy choice between lower priced food with basic health and environmental related quality attributes versus potentially more expensive food with higher (environmental and health) quality attributes.
3.6.2.Sustainable Development Goals
One of the cross-cutting objectives of the new CAP is to improve sustainable development for farming, food and rural areas. This objective is tightly intertwined to the United Nations Sustainable Development Goals (SDGs). This chapter outlines how the Impact Assessment takes the SDGs into account by mapping them against the operational objectives (OOs).
Sustainable Development Goals were adopted at the United Nations (UN) in 2015 as part of the 2030 Agenda for Sustainable Development. They consist of 17 goals, divided into 169 targets, which are meant to be reached by 2030. To measure progress in SDGs, the UN has proposed a list of 232 indicators.
However, not all are necessarily appropriate for the EU. Thereby, Eurostat has defined a set of 100 EU-relevant indicators, which are followed annually.
So far, one follow-up report has been published by Eurostat
. The report concludes that the EU has made considerable progress related to sustainable energy (SDGs 7 and 12), health and urbanization (SDGs 3 and 11). In environmental SDGs, improvements are visible e.g. in forest management and water quality (SDGs 6 and 15) and the EU is expected to reach its targets in climate change mitigation (SDG 13). However, very little progress is made in terms of biodiversity. Slightly less improvement is visible in education, partnership for SDGs and sustainable industrialization (4, 17 and 9). The progress is moderate in terms of employment and growth, poverty reduction and gender equality (8, 1 and 5). Despite the improvements in sustainable food production (SDG 2), the report concludes the overall progress in terms of food security has been limited. Negative trends were found in inequality (SDG 10), which has been increasing.
3.6.2.1. Why consider SDGs in the Impact Assessment?
The SDGs address not only developing countries but also developed countries, including the EU. To underpin its engagement to SDGs, the European Commission published a Communication “Next steps for a sustainable European future”. The Commission states it “will mainstream the Sustainable Development Goals into EU policies” and emphasizes that “agriculture plays a substantial role in the 2030 Agenda”. This was reiterated in the Communication “The Future of food and farming”. To maximise the contribution of the future CAP beyond earlier identified Goals, additional SDGs were considered, in particular: 3 (healthy lives), 11 (human settlements) and 10 (reduce inequalities). Given these commitments, the SDGs are inherently part of the CAP reform and nearly all SDGs were covered by the operational objectives in the Impact Assessment preceding the policy proposal.
3.6.2.2. How has the CAP contributed to SDGs so far?
The CAP has a pivotal role to ensure the EU will deliver on the SDGs. Agricultural policies, although being sectoral, touch upon nearly all SDGs indirectly or directly. Therefore, it is crucial to follow how the CAP performs in these terms. However, measuring the impacts of the CAP on SDGs is a challenging task. This is due to the wide scope of SDGs and the gaps in available indicators. Certain SDG targets would be highly relevant for the CAP and their interlinkages would be worth measuring. However, good quality data and feasible indicators are not always available, e.g. for the SDG target 12.3 on food waste or 2.5 on agricultural genetic resources. Also, the causalities between the CAP and the SDGs are sometimes difficult to establish, especially when considering rural development more widely. For instance, Member States have many national policies that influence growth and employment in rural areas, or inequality between territories (SDGs 8 and 10).
While Eurostat provides a comprehensive analysis of the EU’s performance in SDGs, it does not examine the influence of policies on the result. This is done in a recent literature review commissioned by the European Environmental Bureau (EEB) and Birdlife.
The study scrutinized the impact of the CAP on 12 relevant SDGs by reviewing an extensive body of literature, using a methodology similar to the Fitness Check approach of the European Commission. The study concluded that the CAP contributes to SDGs concerning poverty and food security (1, 2) in the EU, whereas the impacts outside the Union are varied. In environmental questions (SDGs 6 and 15), the CAP has led to local improvements but overall, the greening approach and other environmental measures have yielded limited results. Some gaps remain also in the measures addressing climate change mitigation (SDG 13) and the study suggests that true decoupling of emissions from production has to be improved. In terms of inequality (SDG 10), the CAP has contributed to more balanced territorial development but the distribution of payments is considered disproportionately skewed towards large farms. The SDGs concerning health and responsible consumption and production (SDGs 3 and 12) are found to be not fully addressed. For instance, food waste and losses are not considered in the current design of the CAP, although it could fall in the scope of agricultural policies. In employment and growth (SDG 8), the study focuses on green growth and considers the CAP has had contradictory impacts, as it supports a wide range of farming systems, which cannot always be classified as green growth. However, the number of publications varies widely across SDGs and especially those related to health, energy and inequality (SDGs 3, 7 and 10) were only few.
3.6.2.3. How were SDGs integrated in the Impact Assessment?
Sustainability was mainstreamed in the design of the Impact Assessment and thereby also SDGs were an integral part of the exercise. Firstly, the policy objectives of the Impact Assessment were structured around the three dimensions of sustainability – social, environmental and economic – which ensures that each is taken into account. The second step was to ensure links with the SDGs. This was done by creating a comprehensive set of operational objectives, which would cover the SDGs as widely as possible. In some cases, the objective itself does not directly relate to an SDG but the indicators used to assess the objective do.
Altogether, 13 SDGs were covered in the Impact Assessment, as outlined in
Table 3.15
. There were clear links with ten SDGs (1, 2, 3, 6, 8, 9, 10, 13, 15), meaning that the operational objectives can be directly associated with one or several SDG targets. Two SDGs were covered indirectly (4 and 5). In these cases, the operational objectives do not explicitly address these SDG themes but they were reflected in the Multi-Criteria Analysis. The remaining two SDGs (12 and 17) are overarching goals that can be linked to the exercise as a whole.
Table 3.15. SDG targets covered in the Operational Objectives. These refer to economic (ECO), social (SOC) or environmental (ENV) objectives or the cross-cutting objective on modernization (MOD) (see previous sections).
|
SDG
|
SDG targets addressed
|
Links with Impact Assessment
|
|
SDG 1
Poverty
|
SDG 1.2. By 2030, reduce at least by half the proportion of men, women and children of all ages living in poverty in all its dimensions according to national definitions.
|
SOC 6. Reduce inequalities between territories.
Indicator: Level of rural poverty split by territory
SOC 7. Reduce inequalities between groups.
Indicator: Poverty index in rural areas.
|
|
SDG 2
Food security
|
SDG 2.3 By 2030, double the agricultural productivity and incomes of small-scale food producers, in particular women, indigenous peoples, family farmers, pastoralists and fishers, including through secure and equal access to land, other productive resources and inputs, knowledge, financial services, markets and opportunities for value addition and non-farm employment
NB. Focus on agricultural productivity and incomes overall, not necessarily those of small-scale producers
SDG 2.4 By 2030, ensure sustainable food production systems and implement resilient agricultural practices that increase productivity and production, that help maintain ecosystems, that strengthen capacity for adaptation to climate change, extreme weather, drought, flooding and other disasters and that progressively improve land and soil quality
SDG 2.5 By 2020, maintain the genetic diversity of seeds, cultivated plants and farmed and domesticated animals and their related wild species, including through soundly managed and diversified seed and plant banks at the national, regional and international levels, and promote access to and fair and equitable sharing of benefits arising from the utilization of genetic resources and associated traditional knowledge, as internationally agreed
SDG 2.b Correct and prevent trade restrictions and distortions in world agricultural markets, including through the parallel elimination of all forms of agricultural export subsidies and all export measures with equivalent effect, in accordance with the mandate of the Doha Development Round
|
ECO 4. Productivity and efficiency gains.
Indirect links with:
ECO 1. Cope with price volatility
ECO 2. Improve risk management
ECO 6. Add value to agricultural products
All ENV objectives
ENV 2. Preserve agricultural genetic resources
ECO 5. Demand-driven production models
|
|
SDG 3
Health
|
SDG 3.4 By 2030, reduce by one third premature mortality from non-communicable diseases through prevention and treatment and promote mental health and well-being
SDG 3.9 By 2030, substantially reduce the number of deaths and illnesses from hazardous chemicals and air, water and soil pollution and contamination
|
SOC 9. Contribution to healthier lifestyles.
ENV 5. Sustainable use of pesticides and antibiotics.
ENV 7. Reduce air pollution.
|
|
SDG 4
Education
|
SDG 4.4. By 2030, substantially increase the number of youth and adults who have relevant skills, including technical and vocational skills, for employment, decent jobs and entrepreneurship
SDG 4.7. By 2030, ensure that all learners acquire the knowledge and skills needed to promote sustainable development, including, among others, through education for sustainable development and sustainable lifestyles, human rights, gender equality, promotion of a culture of peace and non-violence, global citizenship and appreciation of cultural diversity and of culture’s contribution to sustainable development
|
MOD 1. Enhancing Agricultural Knowledge and Innovation Systems and strengthening links with research
MOD 2. Strengthening of farm advisory services within the Agricultural Knowledge and Innovation Systems
Not explicitly part of the objectives. However, the importance of skills was considered when assessing how research and advisory services help complying with environmental requirements.
|
|
SDG 5
Gender equality
|
SDG 5.1 End all forms of discrimination against all women and girls everywhere
|
Not explicitly part of the objectives. However, gender equality was reflected on when assessing SOC 7. (Reduce inequalities between groups) and SOC 4. (Foster inclusive growth in rural areas).
|
|
SDG 6
Water
|
SDG 6.3 By 2030, improve water quality by reducing pollution, eliminating dumping and minimizing release of hazardous chemicals and materials, halving the proportion of untreated wastewater and substantially increasing recycling and safe reuse globally
SDG 6.4 By 2030, substantially increase water-use efficiency across all sectors and ensure sustainable withdrawals and supply of freshwater to address water scarcity and substantially reduce the number of people suffering from water scarcity
|
ENV 1. Improve water quality and use
ENV 1. Improve water quality and use
ENV 4. Enhance the adaptation capacity of farms.
Indicator: Efficient water use
|
|
SDG 7
Energy
|
SDG 7.2 By 2030, increase substantially the share of renewable energy in the global energy mix
|
ECO 4. Productivity and efficiency gains
ECO 6. Add value to agricultural products
ENV. Sustainable and efficient management of resources
|
|
SDG 8
Growth and employment
|
SDG 8.1 Sustain per capita economic growth in accordance with national circumstances and, in particular, at least 7 per cent gross domestic product growth per annum in the least developed countries
SDG 8.2 Achieve higher levels of economic productivity through diversification, technological upgrading and innovation, including through a focus on high-value added and labour-intensive sectors
SDG 8.3 Promote development-oriented policies that support productive activities, decent job creation, entrepreneurship, creativity and innovation, and encourage the formalization and growth of micro-, small- and medium-sized enterprises, including through access to financial services
SDG 8.5 By 2030, achieve full and productive employment and decent work for all women and men, including for young people and persons with disabilities, and equal pay for work of equal value
|
SOC 3. Foster income and value added in rural areas
SOC 4. Foster inclusive growth in rural areas
ECO 4. Productivity and efficiency gains
ECO 6. Add value to agricultural products
ECO 9. Development of alternative value chains
MOD 1. Enhancing Agricultural Knowledge and Innovation Systems and strengthening links with research
MOD 3. Incentivising interactive innovation projects
MOD 4. Supporting digital transition in agriculture
SOC 2. Foster employment in rural areas
|
|
SDG 9
Infrastructure and industry
|
SDG 9.1 Develop quality, reliable, sustainable and resilient infrastructure, including regional and trans-border infrastructure, to support economic development and human well-being, with a focus on affordable and equitable access for all
|
SOC 5 – Improve access to infrastructure in rural areas.
|
|
SDG 10
Equality
|
SDG 10.2 By 2030, empower and promote the social, economic and political inclusion of all, irrespective of age, sex, disability,
race, ethnicity, origin, religion or economic or other status
SDG 10.3 Ensure equal opportunity and reduce inequalities of outcome, including by eliminating discriminatory laws, policies and practices and promoting appropriate legislation, policies and action in this regard
|
ECO 3. Provide income support in a targeted way
SOC 6. Reduce inequalities between territories
SOC 7. Reduce inequalities between groups
SOC 1. Foster generational renewal in agriculture and rural areas
SOC 4. Foster inclusive growth in rural areas
SOC 5. Improve access to infrastructure in rural areas
|
|
SDG 11
Urbanization
|
Not covered
|
Not covered
|
|
SDG 12
Sustainable consumption and production
|
SDG 12.2 By 2030, achieve the sustainable management and efficient use of natural resources
SDG 12.3 Cutting in half per capita global food waste at the retail and consumer level, and reducing food losses along production and supply chains (including post-harvest losses) by 2030
|
All ENV objectives
ECO 4. Productivity and efficiency gains
ECO 5. Demand-driven production models
ECO 6. Add value to agricultural products
|
|
SDG 13
Climate action
|
SDG 13.2 Integrate climate change measures into national policies, strategies and planning
|
ENV 3. Prevent and reduce GHG emissions
ENV 4. Enhance the adaptation capacity of farms
ENV 9. Increase carbon storage
|
|
SDG 14
Marine ecosystems
|
Not covered
|
Not covered
|
|
SDG 15
Terrestrial ecosystems
|
SDG 15.1 By 2020, ensure the conservation, restoration and sustainable use of terrestrial and inland freshwater ecosystems and their services, in particular forests, wetlands, mountains and drylands, in line with obligations under international agreements
SDG 15.3 By 2030, combat desertification, restore degraded land and soil, including land affected by desertification, drought and floods, and strive to achieve a land degradation-neutral world
SDG 15.5 Take urgent and significant action to reduce the degradation of natural habitats, halt the loss of biodiversity and, by 2020, protect and prevent the extinction of threatened species
|
ENV 10. Maintain and improve culturally valued landscapes (including HNV Farming).
Indicators: Landscape diversity index; Share (%) of HNV farming
ENV 6. Improve soil condition
ENV 9. Increase carbon storage
ENV 8. Improve farm and forest biodiversity
|
|
SDG 16
Peace and governance
|
Not covered
|
Not covered
|
|
SDG 17
Partnership
|
SDG 17.14 Enhance policy coherence for sustainable development
|
Coherence ensured by having sustainability as cross-cutting objective
|
Annex 5.1 Policy options for the IA
Options were developed to test how EU objectives can be best met while reflecting broad ideas of the ongoing public debate. Some elements are common to all options: the budgetary framework and the delivery model, as well as market measures, competition provisions and the basic layer of conditionality.
1.Elements common to all options
1.1.Budgetary framework
The budgetary assumptions reflect MS envelopes at the end of the current financial period, and treat the currently applied flexibility between pillars as revealing MS policy preferences. External convergence is tested by assessing the potential consequences of an EU flat rate payment.
For all options, the budgetary envelopes were determined by assuming that the consequences of Brexit translate into an 8.9% reduction in CAP budget. With a constant budget for market measures retained, the reduction in direct support would reach 10%, and is applied linearly to all interventions in the Post Brexit baseline option. In the other options, the distribution of the reduced envelope reflects changes in policy priorities.
The current architecture of 2 pillars (and 2 funds) is kept for all options, but CAP strategic plans are meant to cover interventions in both pillars. The option design implies a partial transfer of funds from direct payments to risk management tools. MS may decide to opt for other transfers between pillars. In this IA framework the eco-scheme (an incentive scheme to adopt agricultural practices beneficial to environment and climate) is mainly tested under pillar I, with the support to areas with natural constraints (ANC), currently mainly under pillar II, provided under pillar I in one of the options.
National co-financing of direct payments was assessed separately and is not specifically addressed in the different options, except in the case of ANC; should MS priorities lead to a reduction in EU funding in pillar II for ANC, it is assumed that national contributions would compensate farmers in areas with reduced support.
1.2.Delivery model and planning
All options reflect the greater subsidiarity given to MS to plan CAP interventions against EU objectives and to shift from compliance to performance. Since MS potential choices in their future CAP Strategic Plans are not yet known, options illustrate different ways to achieve these objectives, more particularly in terms of environmental performance as well as for support for targeting and re-distribution. In addition, options were designed to test the differences between voluntary and mandatory (conditionality) approaches to achieve higher environmental sustainability. Finally, sub-options were defined to reflect possible differences mainly in MS environmental ambition as well as for climate action. This enables assessing a potential range of impacts and informing proposals for the new delivery model.
1.3.Knowledge, innovation and technology
Higher environmental ambition of the CAP cannot be reached without strong support for knowledge, innovation and technology. Moreover, social innovation and the development of services and infrastructure in rural areas (including Information Communication Technologies) are key elements in the promotion of rural vitality, growth and jobs.
Therefore all options reflect a higher emphasis on advice, knowledge transfer and cooperation and promote integrated approaches. The integration of advisors into innovation networks, coordination of the European Innovation Partnership for Agricultural Productivity and Sustainability (EIP-AGRI) and LEADER, integration of the farm advisory services (FAS and AKIS) within the EIP and CAP networks, all should allow the development of pilot schemes addressing EU objectives (e.g. carbon initiatives, sustainability assessments…).
1.4.Market-related measures
A set of changes was introduced in the competition provisions of the Common Market Organisation (CMO) Regulation in the OMNIBUS regulation. The position of producer organisations (POs) was strengthened, and farmers were provided with the right to ask for a written contract, unless their trading partner is a SME. These provisions entered into force on 1 January 2018, and no further changes are tested in the IA. What slightly distinguishes the different options is the degree of emphasis on interventions promoting competitiveness (including setting up POs).
Moreover, the existing sectorial programmes (for fruits and vegetables, wine and apiculture) are included in the CAP strategic plans to optimise the potential of these tools to contribute to increase EU competitiveness and improve farmers' position in the value chain. This integration can improve the targeting of the measures to EU priorities (resilience, environmental and climate action, smart farming, innovation…).
Finally, options include various assumptions for risk management, as specified thereafter.
Specific measures for agriculture have been implemented in Outermost Regions through the POSEI scheme (Programme of options specific to the remote and insular nature of the outermost regions). In its report presented in December 2016 after an external evaluation of the scheme, the Commission concluded that POSEI appears critical to maintaining the agricultural production in these regions and to ensure a sufficient supply in agricultural products. The Communication adopted on 24 October 2017 on the strategy for outermost regions stated, as regards CAP measures: "The Commission will seek the continuation of the POSEI Regulation, without prejudice to the negotiations foreseen for the future multiannual financial framework, and seek to maintain specific provisions for the outermost regions in the European Agricultural Fund for Rural Development". Against this background, this impact assessment does not consider any specific change for OR.
1.5.Conditionality and green architecture of the CAP
To enhance environmental and climate ambition, all options include changes regarding cross-compliance and greening. Under cross-compliance, farmers face a possible reduction of their CAP support if they do not comply with requirements. The new conditionality includes some additional minimum requirements, applying to all options, and going beyond the current cross-compliance rules.
The additional elements derive mainly from current greening provisions, and aim to overcome some drawbacks identified in previous analyses:
·Carbon sequestration: maintenance of the permanent grassland share in agricultural area at MS/regional level as well as no-ploughing of permanent grasslands in Natura 2000 areas; ban on converting or ploughing wet and peatlands.
·Biodiversity: 3% of UAA dedicated to non-productive elements (landscape features, afforested areas and fallow land); for most MS, it is considered more effective than the current 5% of arable land under ecological focus area; 70% of the latter currently consists of catch crops and nitrogen-fixing crops, which are deemed less beneficial to biodiversity than landscape elements.
·Soil: simple 2 year crop rotation, more beneficial than the current crop diversification.
·Water quality: the current cross-compliance already includes most of the EU statutory rules applying to farming. An extension of the scope is envisaged under future conditionality, for instance the need to have a nutrient management plan is extended to all agricultural zones (i.e. not only in Nitrates vulnerable zones as currently).
·Without exemptions: in the current greening scheme, various exemptions exist for certain types of farms (e.g. organic) and based on farm area size.
Beyond conditionality, MS would have the possibility to opt for voluntary schemes, based on an incentive approach via an eco-scheme or based on costs incurred and income foregone via agri-environment, climate action and health interventions (AECH). The eco-scheme could be a condition for joining more ambitious AECH measures. Environmental top-ups are also tested in this IA (option 5). Starting from an analysis of MS/regional needs and challenges, MS are free to develop the best intervention logic. MS could accept that organic farming and potentially other certified schemes (such as agro-ecology, conservation agriculture…) automatically qualify for eco-scheme.
The eco-scheme and AECH schemes are voluntary, and can be granted only to adopt practices beyond regulatory requirements (including conditionality), thus offering flexibility to reward farmers addressing specific territorial and sectorial challenges. By contrast, conditionality is compulsory as a tool to enforce the law and any additional requirements set at EU or MS level. It represents the baseline for supporting more ambitious practices.
2.Options description
Disclaimer:
·Options are illustrative and not prescriptive
·Options are not mutually exclusive
·Options are designed to test sets of instruments
·Options do not prejudge the final decision of the Commission (no preferred option)
·The preferred option could combine instruments derived from the different options
2.1.Option 1: Updated baseline
Option 1 corresponds to an update of the baseline (2030 market environment and 2013 CAP reform fully implemented) with the post-Brexit budgetary envelopes.
2.2.Option 3: Incentives for environment, climate action and health
This option aims at testing climate action and environmental services provision with voluntary approaches based on incentives, reflecting specific territorial concerns and reduced income support. Option 3 also examines if the objective of viable farm income can be reached with increased support for risk management tools (including income stabilisation tools) and lower direct payments. Two sub-options (ambitious and conservative) are tested in order to reflect different MS environmental ambitions and approaches to direct payments (it can be assumed that MS choices will likely fall in between the ambitious and conservative version of option 3).
2.2.1.Option 3a: Stronger priority on environment than on economic sustainability
Higher environmental ambition is reflected in an eco-scheme which is based on a wide range of farm practices deemed beneficial to environment, climate and health.
A payment incentive corresponding to 60% of pillar I envelope would allow MS traditionally spending a high share of their rural development envelope on AECH to increase their pillar II focus on other interventions. In MS currently dedicating a large share of RD funds to AECH, their spending is set at 30% max of pillar II envelope to reflect the switch to incentive schemes in pillar I.
The basic layer of income support is reduced (25% of pillar I envelope) and granted as a MS flat rate capped at 100 000 EUR per farm (applying a salaries correction not to penalise employment). However, the support to areas with natural constraints (ANCs) is maintained to ensure a minimum of territorial balance. To target genuine farmers, a minimum requirement of 2 ha for receiving decoupled payments is tested.
The reduction in income support is a strong incentive to reduce risk exposure via alternative paths for adaptation to climate change and via the adoption of various strategies to cope with yield, price and income variability such as insurances, mutual funds, futures and income stabilisation tools. Therefore, in this option 10% of pillar I envelope is made available for risk management tools. Because the reduction of income support might increase entry barriers for young farmers, 5% of pillar I is used to develop a streamlined approach to attract new farmers.
As regards knowledge, innovation and technology, ring-fencing of EIP is tested and the minimum allocation to LEADER is increased. These also contribute to strengthen competitiveness together with more investment grants and to improve farmers' position in value chains by enhancing cooperation and more specifically the setting up of POs.
2.2.2.Option 3b: Lower environmental ambition, but greater focus on DP redistribution
In this sub-option, the environmental performance and climate challenges are reached via a lower eco-scheme (30% of pillar I envelope and less requirements), and the maintenance of a significant AECH framework.
Income support is a stronger priority in this sub-option. The basic layer of income support (around 30% of pillar I envelope) is granted as a decoupled payment. Entitlements are kept as no further convergence of the direct payment level per hectare between farmers is looked for in the 9 MS currently not applying a regional or national flat rate. A strong focus on direct payments redistribution is tested via:
·a redistributive payment to small-medium farms (80 EUR/ha between 2 and 30 ha),
·a capping per farm of the basic income support and the redistributive payment at 100 000 EUR (with salaries correction),
·a capping per hectare of the basic income support and the redistributive payment at 1 000 EUR/ha,
·a minimum requirement of 2 ha for receiving decoupled payments.
The increased support to risk management tools is set at 5% of pillar I envelope.
In addition, Member States are given the possibility to dedicate up to 15% of their pillar I envelop to coupled support, provided that it is better targeted. Three such targets are identified:
·Specific sectors whose importance, difficulties and territorial and environmental contribution have been identified at EU level, such as extensive livestock farming and beehives.
·Sectors such as protein crops contributing to an EU goal for environmental purposes and to reduce import dependency.
·Sectors identified by MS undergoing certain difficulties with the view to overcome these difficulties and improve competitiveness after a certain number of years, thus a phasing out of coupled support.
Due to the difficulties to anticipate MS choices, VCS was modelled as currently implemented.
To promote employment, growth and local development in rural areas, a stronger focus is placed on LEADER and on the basic services and infrastructure provision in rural areas. New farmers are mainly supported via installation grants. These priorities as well as those put on AECH imply a re-allocation of EU pillar II funds and a reduction in EU support to areas with natural constraints, compensated with national funds.
2.3.Option 4: Jointly address environmental and economic sustainability
In this option, direct payments are better targeted and the implementation of conditionality is more ambitious in order to improve the joint economic and environmental performance of the CAP, as well as to address climate challenges.
When setting-up the conditionality requirements, MS have the possibility to enhance conditionality by adding to the minimum requirements applied to the whole EU territory, higher requirements and/or additional simple but effective agri-environment and climate practices related to five EU priorities (biodiversity, water, soil, air, climate), thus targeting their specific national/regional environmental and climate context. Farmers willing to implement more ambitious practices best suited to their farms will continue receiving rural development support (agri-environment-climate schemes, investments, training, advice etc.).
Similarly as for option 3, sub-options are developed to illustrate possible differences in MS ambition regarding environmental targets. Sub-option 4a is equally ambitious in terms of environmental objective as option 3a, but tests the possible outcome of a conditional system (versus voluntary approaches). By contrast, sub-option 4b is more flexible (no more ambitious conditionality) leaving scope to MS to deliver more on environment using solely rural development interventions.
To increase delivery results, including on competitiveness, this option puts a strong focus on knowledge, innovation and technology, mainly via enhanced EIP. Given this strong focus (and on AECH), certain MS using currently a large share of their RD envelope to grant income support in ANCs are assumed shifting priorities and using more national funds to support farm income in these areas. Similarly, investment grants remain available only to small farmers, while larger farmers receive investments support via financial instruments.
There is no distinction between sub-options regarding how the income objectives are addressed; option 4 aims at keeping strong income support, acknowledging that environmental benefits are not just reached via conditionality, but also by keeping farmers in business.
Option 4 tests an integrated direct payment support system more targeted at farming systems in need of support and contributing to the environmental and climatic objectives. While remaining decoupled, the basic payment is adjusted according to land type (arable land, permanent grass land, permanent crops) with redistribution to permanent grassland at the expense of arable land. Voluntary coupled support changes its focus to supporting only extensive livestock production, thereby linking it to environment and climate objectives, as well as productions with specific challenges related to loss of landscape and habitats.
To ensure a maximum redistribution of payments, farms receive a basic payment of maximum 100 000 EUR (with salaries correction), with the product of capping redistributed to smaller farmers. To target genuine farmers, a minimum requirement for receiving decoupled payments equivalent to 2% of the agricultural income is introduced (ranging therefore from 100 EUR to 1 000 EUR per farm according to MS). In addition, to address income variability, increased support to risk management tools is set at 5% of pillar I envelope.
2.4.Option 5: Focus on small farms and the environment
This option lays strong emphasis on environmental care and employment – and shifts the focus on small farmers as a key to success in keeping jobs in rural areas. It redistributes pillar I direct support from larger to smaller farms, testing a decoupled payment modulated by size (explained below) and a maximum of 60 000 EUR granted by farm (with salaries correction). In addition, Member States are given the possibility to dedicate up to 10% of their pillar I envelop to voluntary coupled support provided that it is targeted to EU goals.
This option tests two schemes: support to extensive livestock production, considered at risk without support yet contributing to carbon sequestration, landscape and habitats, as well as protein-rich crops for their environmental benefits and to increase the supply of non-GM proteins.
It targets also farmers most in need in areas with natural constraints via a top up granted in pillar I and climate action and sustainable management of natural resources via top ups to organic farming, permanent grassland and hedges. Though always based on strategic planning, especially regarding RD funds, this option reflects a more prescriptive approach setting an allocation of 30% of the direct payment envelope to these tops ups. Beyond minimum conditionality and these top ups, MS are invited to dedicate a large share of pillar II envelope to support farmers adopting more ambitious farm practises (via agri-environment-climate measures based on incentives or costs incurred and income foregone). This switch in priorities is eased by the fact that in this option, support to ANC is granted in pillar I.
The thus greater availability of pillar II funds permits in this option a strong focus on knowledge, cooperation, innovation (social and environmental) and jobs creation through EIP and Leader projects. In addition, in order to improve generational renewal, in particular access of young farmers to the sector, under this option the introduction of a compulsory enhanced top-up payment for young farmers is assessed.
The competitiveness challenge is addressed by a move towards more targeted use of public support for investment. Grant support for investments would focus on smaller businesses – including in the farm and forestry sector – as well as on investments bringing wider benefit (e.g. in terms of basic services in rural areas). However, investment support through financial instruments would be made available for all beneficiaries, of whatever size.
In order to address the issue of imbalance in the value chain and addressing consumers' expectations, this option would enhance support for setting up producer organisations and for cooperation for short supply chains and local markets under Rural Development, as well as the top ups to organic farming.
Box: The decoupled payment modulated by size assessed in option 5
The level of payment depends on the size of the farm relative to the average farm size in MS. All the hectares of a farm below half the national average size are granted 150% of the average national payment per ha. Between 50% and 100% of the size, the payment is 130% of the average; between 100% and 150% of the size, the payment is 30% below average and for all the hectares above the payment is the average divided by 2.
|
For example, in CZ the average farm size was around 120 ha in 2013. The average basic payment per ha is around 150 EUR/ha. But the first 60 hectares of all farmers are eligible to a higher payment of 280 EUR/ha*.
A farmer with 130 ha would be granted:
60*280+60*245+10*130 = 32 800 EUR
|
Basic payment per ha in CZ by size
Source: DG AGRI
|
Share of CAP budget dedicated to environmental performance and climate action at EU level
|
|
Option 1
|
Option 3a
|
Option3b
|
Option 4a
|
Option 4b
|
Option 5
|
|
Eco-scheme
|
0
|
44%
|
22%
|
0
|
0
|
0
|
|
Top ups
|
0
|
0
|
0
|
0
|
0
|
10%*
|
|
AECH**
|
9%
|
8%
|
9%
|
9%
|
9%
|
11%
|
|
Contributing interventions not accounted for
|
Conditionality
|
|
|
|
|
|
Support redistribution to permanent grassland and targeted coupled support to extensive livestock
|
Targeted coupled support to extensive livestock
|
|
|
|
|
|
More ambitious conditionality
|
|
|
|
Total share in CAP budget
|
9%
+ share of DP
Jointness
|
52%
+ share of DP
Jointness
|
31%
+ share of DP
Jointness
|
9%
+ share of DP
Jointness
|
9%
+ share of DP
Jointness
|
21%
+ shareofDP
Jointness
|
Income support and redistribution
|
|
Option 1
|
Option 3a
|
Option3b
|
Option 4***
|
Option 5
|
|
Decoupled payments*
|
High
|
Very small
MS flat rate
|
Medium
|
Strong
flat rate by land type
|
Medium
degressive with size
|
|
Voluntary coupled support
|
High
|
0
|
High
targeted to EU goals and improving competitiveness
|
Small
targeted to extensive livestock
|
Potentially high targeted to EU goals
|
|
Areas with natural constraints
|
Lower further to Brexit
|
Maintained
in pillar II
|
Maintained in pillar II (higher national funds)
|
Maintained in pillar II (higher national funds)
|
Increased
top up in pillar I
|
|
Payment redistribution
|
Top up to first ha in 8 MS.
Degressivity in 14 MS from 150 000 EUR, % cut vary by MS from 5 to 50%**
|
0
|
To small-medium farms via a top up to first 30 ha
|
To farmers with lower income
via an increase in support to permanent grassland
|
To small-medium farms
via the modulation of support by size
|
|
Capping per farm (with salaries correction)
|
Limited,
in 8 MS
threshold from 150 000 to 500 000 EUR
|
100 000 EUR
|
100 000 EUR
|
100 000 EUR
|
60 000 EUR
|
|
Capping per ha
|
|
|
1 000 EUR
|
|
|
|
Min. requirements
|
Threshold in EUR or ha varies from 0.5 to 4 ha and from 100 to 500 EUR
|
2 ha
|
2 ha
|
2% of ag. income (varies by MS, from 100 to 1 000 EUR)
|
Status quo
|
* includes the basic payment scheme, the single area payment scheme and greening
** e.g. amounts above 150 000 EUR per farm (with salaries correction) are cut by 5% in BG and by 50% in IT.
*** options 4a and 4b are similar in terms of direct payments implementation.
Annex 5.2 Methods and tools
1.Introduction
In this Impact Assessment (IA) a combination of quantitative and qualitative methods is used. Different types of analysis require different methods/set of tools.
1.
To quantitatively underpin the problems (and contribution of associated drivers) related to the current situation, information from indicators, evaluations, studies and prior modelling exercises is combined.
2.
To analyse the economic, social and environmental impact as well as the administrative burden of the different options, 2 approaches are pursued:
2.1.
For those elements (instruments) of the options which can be integrated in (one or more of) the models, (some of) the impacts can be quantified.
2.2. For those elements which cannot be modelled, a semi-quantitative approach based on internal expert judgement is followed. This entails scoring of the options by different experts (mostly within the Commission) following an intervention logic and informed by available analysis and literature.
3.
The impacts of the baseline (current CAP) and the options obtained from step 2 are compared and aggregated by means of Multi-Criteria Analysis (MCA)
The first part gives a brief outline of the main models used, the expert judgement approach and the multi-criteria analysis. The second part describes in more detail which methods/models are used in which part of the IA. The caveats of the modelling assessment are described in relevant sections of the analysis.
2.Brief description of the main models and tools used in the IA
2.1.MAGNET
MAGNET (Modular Applied GeNeral Equilibrium Tool) is a global general equilibrium model, whereby the GTAP (Global Trade Analysis Project) model has been augmented with specialist modules tailored to the specific focus of the study. GTAP is a general equilibrium model covering all sectors of the economy (agriculture, manufacturing and services) as opposed to partial equilibrium models such as CAPRI (Common Agricultural Policy Regional Impact model), which focuses on subsets of an economy. MAGNET includes adaptions and extensions that cover:
•Differences in substitutability of land between sectors
•Imperfect mobility of labour between agricultural and non-agricultural sectors
•Endogenous land supply
•Biofuel sectors and the biofuel directive
•Income elasticities dependent on GDP per capita
•International capital mobility for dynamic analyses
•CAP policy
Beside these adaptions and extensions, MAGNET has also adaptions for investments, bilateral tariff rate quota and alternative consumption functions.
2.2.Aglink-Cosimo
Aglink-Cosimo is a recursive-dynamic, partial equilibrium, supply demand model of world agriculture developed by the OECD and FAO Secretariats. The model is used to simulate development of annual supply, demand and prices for the main agricultural commodities produced, consumed and traded worldwide. Aglink-Cosimo covers 44 individual countries and 12 regions, and 40 commodities clearing markets at world level. At EU level, the Aglink-Cosimo model is used to produce the “Prospects for Agricultural Markets and Income in the EU”. This is a yearly exercise that provides a detailed overview of EU agricultural markets with a 10 year time horizon. It incorporates information from policy makers and market experts in the European Commission, stakeholders, researchers and modellers. The EU Outlook intends to provide a broad consensus about the evolution of European Agriculture in the medium-term. It serves as reference timeline for counterfactual policy analysis and market analysis done in numerous research sites in Europe, including calibrating the baseline of other models such as CAPRI, AGMEMOD, IFM-CAP.
There is uncertainty surrounding key drivers of these markets. The partial stochastic analysis addresses part of these uncertainties and its potential impact on the projections. This kind of probabilistic analysis quantifies the range of possible outcomes around the central baseline value, by reproducing a portion of the past uncertainty observed for key factors. It can also be used to perform scenario analysis.
2.3.CAPRI
CAPRI is a global agricultural sector model with focus on EU28, Norway, Turkey and Western Balkans, iteratively linking:
•Supply module (EU28+Norway+Western Balkans+Turkey): covering about 280 regions (NUTS 2 level)
•Market module: spatial, global multi-commodity model for agricultural products, 47 product, 77 countries in 40 trade blocks
Its objective is to evaluate ex-ante impacts of the Common Agricultural Policy and trade policies on production, income, markets, trade, and the environment, from global to regional scale. It allows for the spatial downscaling for EU-28 of crop shares, yields, stocking densities, fertilizer application rates to 150 000 Homogenous Soil Mapping Units (cluster of 1x1 km grid cells) for environmental impact assessment and link to bio-physical model DNDC (Denitrification Decomposition, a computer simulation model of carbon and nitrogen biogeochemistry in agro-ecosystems). It follows an open source approach with an active network of developers and users, main client is the EU Commission. JRC contributes to its development, maintenance and use for policy analysis.
2.4.IFM-CAP
IFM-CAP, developed and maintained at JRC, is an EU-wide individual farm-level partial equilibrium model (IFM-CAP) aiming to assess the impacts of the CAP on farm economic and environmental performance. The rationale for such a farm-level model is based on the increasing demand for a micro-simulation tool able to model farm-specific policies and to capture farm heterogeneity across the EU in terms of policy representation and impacts. Based on positive mathematical programming, IFM-CAP seeks to improve the quality of policy assessment upon existing aggregate and aggregated farm-group models and to assess distributional effects over the EU farm population. To guarantee the highest representativeness of the EU agricultural sector, the model is applied to the majority of EU-FADN (Farm Accountancy Data Network) individual farms (almost 80 000 farms).
2.5.AIDSK
AidsK is a DG AGRI in-house maintained model based on EU-FADN (containing over 86 000 individual farm accounts) with policy as when fully implemented (2019) and possibility to change direct payments, very useful to work on direct payments distribution as well as winners and losers (types of farming, MS…).
2.6.RUSLE 2015
The Revised Universal Soil Loss Equation (RUSLE) model (Renard et al., 1997) provides an estimate of possible erosion rates and estimates sediment delivery on the basis of accepted scientific knowledge, peer review published manuscripts, technical judgment and input datasets. In this assessment, the basic RUSLE model has been adapted through the improved quality of the input layers.
RUSLE2015 improves the quality of soil erosion estimates by introducing updated, high-resolution (100m) and peer-reviewed input layers of Rainfall Erosivity, Soil Erodibility, Slope Steepness and Slope Length, Land Cover and Management and the Support Practices applied to control erosion.
Figure 1. RUSLE 2015 Model workflow
Rainfall Erosivity was calculated from high-resolution temporal rainfall data (at intervals of 5, 10, 15, 30 and 60 minutes) collected from 1 541 well-distributed precipitation stations across Europe. Soil Erodibility is estimated for the 20 000 field sampling points including in the Land Use/Cover Area frame (LUCAS) survey. The Land Cover and management accounts for the influence of land use (mainly vegetation type/cover and crop type) and management practices (mainly in arable lands) with the potential to reduce the rate of soil erosion by water. The Slope Steepness and Slope Length parameters have been calculated using a high resolution Digital Elevation Model (DEM) at 25m. The support practices were estimated for the first time at European level taking into consideration the Good Agricultural and Environmental Conditions (GAEC). The model is documented in the European Soil Data Centre (ESDAC), plus in 10 peer review Open Access publications.
2.7.Century model
CENTURY is a process-based model designed to simulate carbon (C) and nitrogen (N) dynamics in natural or cultivated systems, using a monthly time step. The soil organic matter sub-model includes three soil organic carbon pools, which decomposition rate is affected by soil temperature and moisture, soil texture and cultivation practices. The model also simulates the soil water balance, using a weekly time step, and a suite of simple plant growth models are included to simulate biomass carbon and nitrogen dynamics of crops, grasses and trees.
The model is currently running in the agricultural soil of the EU on a 1 km2 grid resolution, implemented by state-of-art official datasets. The land use is based on the Corine Land Cover 1990, 2000 and 2006, supplemented with EUROSTAT and FAO statistics to build up crop rotations and implement consistent agronomic inputs (fertilization, irrigation etc.). Before 1990, we assumed the same land use but with different agro-techniques characterized by lower productivity crops, lower rates of mineral nitrogen and different rotation schemes.
Meteorological data were taken from the E-OBS gridded dataset (
http://www.ecad.eu/download/ensembles/download.php
), and the climatic projections from the WCR-CORDEX portal (
https://esgf-node.ipsl.upmc.fr/search/cordex-ipsl/
). Soil data used by the model were derived from the European Soil Database-ESDB, available at the European Soil Data Centre (
https://esdac.jrc.ec.europa.eu/
).
Figure 2. Flow chart of Century model framework
2.8.Standard Cost Model
For the estimation of administrative costs, the "Standard Cost Model" was used as described in the Better Regulation Toolbox (Tool #60). Administrative costs are costs incurred by enterprises, the voluntary sector, public authorities and citizens in meeting legal obligations to provide information on their activities, either to public authorities or private parties. The main aim of the model is to assess the net cost of information obligations imposed by EU legislation.
The EU Standard Cost Model assesses the administrative costs on the basis of the average cost of the required administrative activity multiplied by the total number of activities performed per year. The average cost per activity is estimated by multiplying a tariff and the time required per action. The quantity is calculated as the frequency of required actions multiplied by the number of entities concerned. More information can be found in Annex 7 on Simplification.
2.9.Workshops with experts
To complement evidence, four workshops were organised on the environmental-climate, social and economic challenges, and one workshop on risk management (see Annex 2). The workshops focused on particular topics where evidence on current state or potential impact was insufficiently conclusive. International experts on these topics were invited to present their views and participate in the discussions. The rationale of the workshops was the following:
•definition of the problems;
•identification of desirable measures to address the problems;
•consequences for the policy options and the impact assessment.
2.10.Intervention logic based on expert judgement
For indicators/instruments for which quantitative data from the models are lacking, each option is scored based on expert judgement. The scoring procedure is embedded in the Multi Criteria Analysis methodology (see below). The latter allows to score the baseline as well, useful in absence of an evaluation.
Basic approach, adapted in function of the available information:
•Informed by the intervention logic, available studies, evaluations, scientific literature, in house and external analysis, experts in DG AGRI score the options
•Aggregation is done when several subitems describe an objective
•Weights are attached to the subitems expressing the relative importance of this subitem in reference to the objective
Informed by available data and literature, both the weights and subitem scores are generated by experts within DG AGRI in a group scoring exercise. The motivation and documentation of the scores are a key element of the approach.
2.11.Multi-criteria-analysis
2.11.1.Main objectives
•Objective 1: to come to an overall quantitative score for the options against the new policy objectives
•Objective 2: to provide a procedure which allows scoring options against criteria for which there is no modelling outcome
2.11.2.Different uses of Multi-criteria Analysis (MCA)
•Identify trade-offs between economic, environmental and social challenges
•Assessment of coherence, effectiveness, efficiency of different options
•Position of different stakeholders
2.11.3.Main rationale
Options are scored against a list of criteria/indicators, which are linked to each of the new CAP main and specific objectives. This allows identifying which option outperforms the other (with how much). An overall score and a score on each criterion is obtained. Weighting allows putting more emphasis on those criteria more important to reach the objective. A sensitivity analysis on weights is possible to see the influence on options' overall score and position.
The MCA is complementary to a more detailed analysis of individual indicators. The accompanying argumentation why options perform better/worse than others remains pivotal. No direct scoring of instruments within options against criteria will be done, but the intervention logics, linking instruments within options to objectives, will be informative to assess the impact of options on criteria.
2.11.4.Software
The MCA is performed with the help of the MacBeth
software. As it needs only qualitative judgements about the difference of attractiveness between two elements at a time, in order to generate numerical scores for the options in each criterion and to weight the criteria, it is perfectly suited to assess the options' impact against criteria for which a quantitative modelling outcome is lacking. The software also allows checking for inconsistencies and facilitates a sensitivity analysis on weights.
3.Description of tools used in the different phases
3.1.Evaluation of baseline
The EU baseline is composed of a combination of sources, more detailed below:
•DG AGRI EU agricultural outlook 2016 and 2017
•AidsK
•Scenar 2030 baseline
•Input from the CAP context and impact indicators, Eurostat indicators, several evaluations and (external) studies.
The
EU agricultural outlook
provides 10-year projections of agricultural markets and income, with focus on the EU. Its main uses are to better understand markets and their dynamics, to identify key issues for market and policy developments and to have a benchmark for assessing the medium-term impact of future market and policy issues.
It offers a description of what may happen under a specific set of assumptions, which at the time of making the projections were judged plausible. It covers the main commodities (grains, meats, dairy, biofuels, sugar – being extended to olive oil, wine and some fruit & vegetables). The underlying model is Aglink-Cosimo (OECD-FAO). The Outlook provides results in terms of supply balance sheets (production, consumption, imports, exports, stocks) and prices. The starting point is the OECD-FAO Outlook, in which the DG AGRI Short-Term Outlook is incorporated, as well as the new macro-economic and policy assumptions. It is a joint production between DG AGRI and the JRC. The Outlook is extensively discussed with AGRI market experts and hierarchy, as well as with international experts during the Outlook workshop. The final result is presented during the EU Agricultural Outlook Conference, in presence of Commissioners and international organisations.
Within this IA, the EU agricultural outlook 2017-2030 provides the price environment and main market trends. Its main underlying assumptions are:
•CAP 2013 (but limited modelling, AGLINK is aggregated at EU-15 and EU-N13 level)
•Only ratified FTAs (including Canada)
•For the IA, CAP assumptions include OMNIBUS (common proposal on simplification of CAP), i.e. Income Stabilisation Tool (IST) changes, but this has no real implications on market developments, only when assessing different ways to provide IST.
•COP21, air quality, energy package are not incorporated. The Paris Agreement (as a result of the 21st Conference of Parties of the UN Framework Conference on Climate Change) and subsequent Commission proposals on Climate/Energy are not embedded in the baseline. Indeed, they form part of the contextual elements that have changed since the last reform. Changes related to Climate Change, Energy or Environment are addressed in options.
Scenar 2030 is a JRC D4 (Unit Economics of Agriculture) study outlining projections for EU agriculture in 2030. It considers 3 scenarios: Status quo, Strong reduction of EU Agricultural policy (liberalisation scenario of the IA) and Sustainable Competitiveness (enhanced greening). In the Scenar 2030 exercise the analytical power of three models (MAGNET, CAPRI and IFM-CAP) is combined through soft links.
Figure 3. Scenar 2030 model chain
For the baseline, the status quo, Magnet, CAPRI and IFM-CAP are projected towards 2030 and calibrated to the 'EU agricultural outlook 2016-2026':
•For Magnet (CGE model, MS, base year 2011) it means simulating 2030, checking trade position, price and production developments to make sure that they align with the agricultural outlook;
•For CAPRI (PE model, MS, Nuts2) it means EU production/trade/consumption levels close to 'EU agricultural outlook 2016-2026', the CAP policy as in 2019.
•For IFM-CAP (farm model, base = FADN 2012), the CAP policy as in 2019 (most detailed model on CAP), calibrated to CAPRI (production, prices)
AidsK (see previous description) is based on FADN 2012 data with CAP fully implemented (2019). It considers the same farm structure as in 2012.
Input from CAP indicators, evaluations and other studies is extensively taken on board, most notably during the MCA-analysis. Main references used for the evidence base can be found in Annex 1 to the IA report.
3.2.Assessing the impact of options
Table 1. Options modelling and other analysis
|
Which model
|
What for
|
|
Scenar 2030
|
The market liberalisation scenario*
|
|
AidsK analysis
|
DP distribution in option 3/4/5
Income stabilization tool
Income variability
|
|
CAPRI
|
Land prices
Production and productivity changes
Trade
Price gap analysis
GHG emissions
Ammonia emissions
Nitrogen balance
|
|
IFM-CAP
|
Land allocation and activities
Agricultural income
Share of farmers with low profitability (in difficulty)
|
|
Magnet
|
Scenar 2030
|
|
AGLINK-COSIMO stochastic
|
Baseline
Effect of countercyclical payments
|
|
RUSLE 2015
|
Soil erosion by water
|
|
Century
|
Soil organic carbon
|
|
RD budget allocation
|
Effect on various indicators from different models
|
* this scenario is described in the Scenar 2030 study4
Within the scenarios only CAP policy measures or market access instruments are altered. All other policies are kept stable throughout the projection period. This includes biofuels policies which are assumed not to alter in 2021. Macro-economic assumptions are identical to the assumptions in the DG AGRI outlook 2015-2025 or DG AGRI outlook 2016-2026, depending on the model.
GHG policies are external to the scenarios. The modelling framework is brought in line with the EC
reference scenario for EU energy, Transport and GHG emission trends to 2025
. Agriculture is responsible for about half of all non-CO2 GHG emissions and is expected to increase its share in total non-CO2 until 2030. The Common Agricultural Policy influences, inter alia, livestock numbers/intensities. The Nitrogen Directive and the Water Framework Directive impact on the use of fertilizer.
For the indicators and instruments for which quantitative data from the models is missing, expert judgement is used, following the procedure outlined under 1.2.10. A list of Operational Objectives for which the qualitative analysis was used is provided in Annex 5.3.
3.3.Addressing uncertainties
Macro-economic uncertainty (or price volatility) is incorporated into the modelling exercise for the CAP instruments for which this is a key issue, such as risk management tools. For example, to analyse the potential use of the Income Stabilisation Tool, farm income is shocked in AidsK with two different sets of output assumptions.
3.4.Comparing the baseline and the options
In addition to the modelling analysis, to cover the items which are not sufficiently captured by the models, and to summarize the impact of the options vis-à-vis the baseline, Multicriteria Analysis is used.
In total, more than 50 DG AGRI experts, as well as scientists from JRC for the environmental objectives, participated in the MCA-exercise. The DG AGRI experts contributed to the IA from the beginning onwards and were selected based on their expertise regarding CAP interventions and challenges. They represent units from all across the DG (unit A1, A2, B1, B2, C, C1, C2, C3, C4, D1, D2, D3, D4, E4, F1, G, G1, G2, G3, G4, H1, I4, R1, R3). Throughout the IA process these experts further built up their expertise on the future CAP as they were part of challenge teams from the start of the IA:
·In these teams, which met on a regular basis from beginning of 2017 onwards, challenges were identified, background documents on challenges drafted, intervention logics and explanatory fiches on options prepared.
·The experts participated in the different workshops organized with academics and other DGs, bringing the lessons learnt into the challenge teams.
·Several of them, especially the group coordinators, also participated in different ISG-meetings and bilateral exchanges with relevant other DGs, also allowing that information was transmitted to inform the expert judgement.
·One of the main tasks of the challenge team experts was the screening of relevant scientific literature from academics and public institutions to scientifically underpin the expert opinions.
The experts were also involved in the actual scoring exercise. Emphasis rested upon the qualitative underpinning of ranking and scoring. The experts also performed the weighting exercise and provided explanations for the attributed weights. In total 5 group exercises were organized, each focusing on a different policy objective:
·For effectiveness:
1.Group focusing on Economic Policy Objective
2.Group focusing on Environmental Policy Objective
3.Group focusing on Social Policy Objective
·For efficiency
4.Group focusing on Simplification objective
·For Future Proofing
5.Group focusing on Modernization objective
The JRC experts were also involved since spring 2017 in many of the group discussions regarding the Environmental Policy Objective. They also participated in the preparation of fiches and the scoring exercise.
The overall followed procedure is:
3.4.1.Step 1: identification of options
5 options, including 2 sub-options, the current CAP baseline for EU27 and a baseline with linear cuts (after Brexit), are compared. Effects of the No CAP scenario are described in Scenar 2030
. Alternative options are described in detail in Annex 5.1. Each option contains the same/different elements/instruments. The design and combination of these instruments determines an option's ability to reach the set objectives.
Figure 4. Synthetic overview of the options
3.4.2.Step 2: construction of value tree
Starting from the identified main CAP objectives (MO), the specific objectives (SO) and the Operational Objectives (OO) associated to each SO (see Annex), a value tree is constructed. These OOs are also considered as criteria entering the MCA. The value tree links criteria (or OOs) to specific objectives and specific objectives to a main objective.
3.4.3.Step 3: identification of criterion properties
Criteria are equal to the Operational Objectives. Depending on the criterion, we can distinguish between 3 situations:
1. The criterion has quantitative performance levels
This is the case when a model-driven score can be obtained for the options. Minimum and maximum levels for the criterion are based on the model outcome for the different options or on legal requirements/EU targets. By means of a transformation function (linear, exponential, logarithmic, stepwise,…), the option scores are translated to scores between zero (for the minimum) and hundred (for the maximum).
2. The criterion has qualitative performance levels which allow ranking
Examples are: the situation has much improved, status quo, worsened etc. These qualitative levels are translated to scores between 0 and 100 based on a (linear) transformation function.
3. No qualitative performance levels can be assigned to the criterion
When a criterion is too complex to assign ordinal levels to it, options are directly compared against each other. This approach was used most frequently. This is done as such:
·Within the group of experts, evidence is presented on how options perform against the criterion. This evidence is based on internal and external analysis, scientific papers, H2020 insights, evaluations, DG AGRI and EP studies, grey literature and informed by the intervention logic (explaining the link between instruments in options and specific objectives).
·Based on group expert judgement, options are ranked from best to worst.
·Based on group expert judgement, a preference matrix is completed. This matrix expresses how strongly (varying from extreme to no preference) the best performing option is preferred over the second best and so on.
·Based on these qualitative scorings, a software based consistency check is performed and quantitative scores are calculated for the options by means of linear programming.
·During this process, notes are taken documenting why the options are scored as such.
3.4.4.Step 4: determination of options' scores
When a model-based quantitative score for the options is available, the scores immediately emerge after entering these in the transformation function accompanying the criterion. When a criterion has qualitative levels, each option is assigned to a specific level based on group expert judgement, again informed by the intervention logic, the available information sources and a group discussion. The process and choices are well documented in fiches. For options directly scored against a criterion, we refer to step 3.3.
3.4.5.Step 5: determination of weights for criteria and objectives
The weighing aims to give a different importance to different criteria depending on their contribution to the specific and main objectives. A stepwise approach is applied: first the criteria within a specific objective are weighed, and after that the specific objectives within the main policy objectives.
Each individual expert provided weights together with a justification. The final weights applied were obtained by averaging over the weights assigned by the individual experts. This step is informed by relevant studies and literature, and the reasoning to come to a certain scoring is documented.
3.4.6.Step 6: analysis of results
In a final step, both overall scores of the options as well as the scores on particular criteria can be analysed.
An overall robustness check shows how robust the obtained result is, i.e. whether an option strictly dominates another (scores better on all criteria) or additively (scores better on some but not on others).
To analyse the importance of the applied weights, sensitivity analysis is performed. This analysis reveals with how much the weight of a criterion should change for 2 options to switch position.
Figure 5. Example of scoring exercise for Economic Operational Objective 2.1
Annex 5.3: Objectives used in the MCA
|
Impact Assessment
|
|
Policy objectives
|
Specific objectives
|
Operational objectives
|
|
ECO
|
|
|
|
Foster
a smart and
resilient
agricultural sector ensuring food security
|
Support viable farm income and resilience throughout the territory
|
Cope with price volatility
|
|
|
|
Improve risk management
|
|
|
|
Provide income support in a targeted way
|
|
|
Increase competitiveness and market orientation
|
Productivity and Efficiency gains
|
|
|
|
Demand-driven production models
|
|
|
|
Add value to agricultural products
|
|
|
Improve farmers position in value chains
|
Strengthen cooperation amongst farmers
|
|
|
|
Enhance synergies within value chain
|
|
|
|
Development of alternative value chains
|
|
ENV-CLIM
|
|
|
|
Bolster
environmental care
and climate action and contribute to the environmental and climate objectives of the EU
|
Contribute to climate change mitigation & adaptation
|
Prevent/reduce GHG emissions
|
|
|
|
Increase carbon storage
|
|
|
|
Enhance farms adaptation capacity
|
|
|
Foster sustainable
and efficient management of resources
|
Improve soil condition
|
|
|
|
Reduce air pollution
|
|
|
|
Improve water quality/use
|
|
|
|
Sustainable use of pesticides and antibiotics
|
|
|
|
Preserve agricultural genetic resources
|
|
|
Preserve nature and landscapes
|
Improve farm and forest biodiversity
|
|
|
|
Maintain and improve culturally valued landscapes (including HNV Farming)
|
|
SOCIO
|
|
|
|
Strengthen
the socio-economic
fabric
of rural areas
|
Attract new farmers and facilitate business development, as well as generational renewal
|
Foster in rural areas
|
|
|
|
- generational renewal
|
|
|
Promote employment, growth and
local development in rural areas
|
- employment
|
|
|
|
- inclusive growth
|
|
|
|
- value added (e.g. bio-economy)
|
|
|
|
Improve
|
|
|
|
- access to infrastructure
|
|
|
|
- access to services
- contribution to healthier lifestyles
|
|
|
|
|
|
|
Address territorial imbalances,
rural poverty and social inclusion
|
Reduce inequalities between
|
|
|
|
- territories - rural/urban divide
|
|
|
|
- groups (rural poverty, social inclusion)
|
|
CROSS CUTTING
|
|
|
|
Improve
sustainable development
for farming, food and rural areas
|
Maximise contributions to EU priorities and SDGs
|
Strengthen links to EU objectives
|
|
|
This includes
|
Streamline Common Indicators (including SDG indicators)
|
|
|
Address societal expectations on food and health (security, safety, quality, sustainability…)
|
e.g. demand-driven, pesticides, antibiotics, healthier lifestyles
|
|
SIMPL-INNO
|
|
|
|
Promote Knowledge & Innovation
in agriculture
and rural areas
|
Co-create innovation and share knowledge, including across generations
|
Enhance Agricultural Knowledge and Innovation Systems and strengthen links with research
|
|
|
|
Strengthen farm advisory services within the AKIS systems
|
|
|
|
Enhance interactive innovation
|
|
|
|
Support digital transition in agriculture
|
|
Simplify the CAP
|
Streamline CAP design and delivery on relevant EU objectives
|
Shift from compliance to performance
|
|
|
|
Reduce administrative burden
|
|
|
|
Enhance proportionality of administrative costs
|
|
|
|
|
Annex 5.4 – Non-productive elements in the EU
|
|
UAA
|
Fallow land
|
Landscape elements
|
Fallow and landscape elements
|
|
|
|
Area
|
Share in UAA
|
Estimation excluding dubious cases* (JRC)
|
|
|
|
Eurostat
|
Eurostat
|
|
|
Share in UAA
|
|
1 000 ha
|
2013
|
2013
|
2013
|
Area
|
Share in UAA
|
|
|
EU
|
154 200
|
5 840
|
4%
|
860
|
1%
|
4%
|
|
BE
|
1 300
|
10
|
1%
|
10
|
1%
|
1%
|
|
BG
|
4 700
|
50
|
1%
|
10
|
0%
|
1%
|
|
CZ
|
3 500
|
10
|
0%
|
0
|
0%
|
0%
|
|
DK
|
2 600
|
30
|
1%
|
10
|
0%
|
1%
|
|
DE
|
16 700
|
200
|
1%
|
90
|
1%
|
2%
|
|
EE
|
1 000
|
40
|
4%
|
10
|
1%
|
5%
|
|
IE
|
5 000
|
10
|
0%
|
40
|
1%
|
1%
|
|
EL
|
4 900
|
140
|
3%
|
10
|
0%
|
3%
|
|
ES
|
23 300
|
2 420
|
10%
|
40
|
0%
|
11%
|
|
FR
|
27 700
|
490
|
2%
|
100
|
0%
|
2%
|
|
HR
|
1 600
|
10
|
0%
|
10
|
0%
|
1%
|
|
IT
|
12 100
|
370
|
3%
|
180
|
1%
|
4%
|
|
CY
|
100
|
10
|
9%
|
0
|
0%
|
10%
|
|
LV
|
1 900
|
60
|
3%
|
10
|
1%
|
4%
|
|
LT
|
2 900
|
90
|
3%
|
10
|
0%
|
4%
|
|
LU
|
100
|
0
|
0%
|
0
|
0%
|
0%
|
|
HU
|
4 700
|
130
|
3%
|
20
|
0%
|
3%
|
|
MT
|
0
|
0
|
5%
|
0
|
0%
|
6%
|
|
NL
|
1 800
|
10
|
0%
|
60
|
3%
|
4%
|
|
AT
|
2 700
|
40
|
1%
|
10
|
0%
|
2%
|
|
PL
|
14 400
|
450
|
3%
|
80
|
1%
|
4%
|
|
PT
|
3 600
|
330
|
9%
|
10
|
0%
|
9%
|
|
RO
|
13 100
|
670
|
5%
|
40
|
0%
|
5%
|
|
SI
|
500
|
0
|
0%
|
0
|
1%
|
1%
|
|
SK
|
1 900
|
20
|
1%
|
0
|
0%
|
1%
|
|
FI
|
2 300
|
250
|
11%
|
120
|
5%
|
17%
|
|
SE
|
3 000
|
160
|
5%
|
50
|
2%
|
7%
|
Note: Linear elements considered here: Grass margins, shrub margins, single trees bushes, lines of trees, hedges and ditches. Dubious cases refer to the difficulty to assess if one linear element belongs to agricultural area or not. In case of doubt, the JRC removed this element from the estimation. Numbers are to be taken with caution; additional work would be required to improve the quality of this estimate.
Source: DG AGRI based on Eurostat and JRC based on LUCAS survey
Annex 5.5: Capping
|
|
Baseline
|
Option 3a
|
Option 3b
|
Option 4
|
Option 5
|
|
Farmers capped
|
3 140
|
0
|
130
|
4 380
|
1 380
|
|
Product of capping (Million EUR)
|
120
|
0
|
10
|
0
|
50
|
|
Share of MS in capped amount
|
|
|
|
|
|
|
HU
|
61%
|
|
|
|
5%
|
|
PL
|
17%
|
|
|
|
0%
|
|
BG
|
12%
|
|
84%
|
|
58%
|
|
CZ
|
4%
|
|
|
|
1%
|
|
SK
|
3%
|
|
|
|
1%
|
|
IT
|
3%
|
|
|
|
1%
|
|
RO
|
|
|
11%
|
|
30%
|
|
DE
|
|
|
4%
|
|
1%
|
|
Income of capped farms
|
31 800
|
|
50 500
|
32 800
|
44 600
|
|
Income of non capped farms
|
28 600
|
|
26 700
|
25 800
|
26 500
|
|
Average employment in capped farms
|
|
|
|
|
|
|
EU
|
47
|
|
20
|
10
|
11
|
|
HU
|
51
|
|
|
12
|
9
|
|
PL
|
64
|
|
|
|
|
|
BG
|
40
|
|
25
|
20
|
16
|
|
CZ
|
54
|
|
|
|
|
|
SK
|
50
|
|
|
|
|
|
IT
|
15
|
|
|
|
|
|
RO
|
|
|
15
|
11
|
12
|
|
DE
|
|
|
2
|
4
|
|
Source: JRC, IFM-CAP model
Annex 5.6: Share of direct payments received by biggest beneficiaries and biggest farms
|
Share of direct payments granted to 20% biggest beneficiaries
|
Share of direct payments granted to 20% largest farms in terms of UAA
|
|
|
|
Source: JRC, IFM-CAP, based on professional farms (FADN data)
Annex 5.7 – Income variability
|
Share of farms with a gross farm income drop beyond 30% compared to the 3 previous years
|
Share of farms with a sector income drop beyond 20% compared to the 3 previous years
|
|
|
|
Source: DG AGRI, FADN
Annex 6: Promoting Modernisation
Modernisation is a cross-cutting objective, for both EU agriculture and food systems, as well as for rural areas. They face many challenges that require new solutions. Innovation is necessary to foster a smart and resilient agriculture sector ensuring food security, to bolster environmental care and climate action, and to strengthen the socio-economic fabric of rural areas. Innovations - along with the corresponding innovation systems - are needed (e.g. on the use of nature based solutions, breeding, vertical farming, zootechnics, biological, technological, digital, developing new chains for bio-economy, organisational and product related) to serve a multi-functional EU agriculture delivering food and non-food products, public goods as well as contributing to vibrant rural areas. Although substantial knowledge exists it stays fragmented and insufficiently applied. Agriculture research may deliver new insights which stay within the scientific world only and also the agricultural sector itself has a considerable and under-used innovation capacity. Overall, take up of new knowledge and technology is absent or slow, bridging the gap between research and farming practice is key.
For the purpose of impact assessment, the following objectives were formulated:
Cross-cutting objective: Promote knowledge and innovation in agriculture and rural areas
Specific objective: Co-creating innovation and sharing knowledge, including across generations
Operational objectives:
1.Enhancing Agricultural Knowledge and Innovation Systems and strengthening links with research
2.Strengthening of farm advisory services within the Agricultural Knowledge and Innovation Systems
3.Enhancing interactive innovation
4.Supporting digital transition in agriculture
1.
Enhancing Agricultural Knowledge and Innovation Systems (AKIS) and strengthening links with research
This is a cross-cutting objective equally relevant for all clusters (economic, environmental and social) and all policy options. Reflections now focus on improving the Agricultural Knowledge and Innovation Systems (AKIS), the systems of people and organisations in countries/regions that generate, share, and use agriculture-related knowledge and information. The main difference is the budgetary allocation that will have an impact on the long-term knowledge infrastructure and the number of projects/interactions that can be supported and as such on the resulting level of innovation and sharing of knowledge. Therefore targeting CAP funding to that kind of measures would be important. The type of knowledge/advice to be supported will be chosen by the MS/region, depending on their needs and the final CAP option and consequently it may have a stronger economic, environmental or social focus. Flexibility is important and is much appreciated by MS (conclusion EIP Evaluation Study
). Knowledge and innovation is horizontal and cross-cutting and can equally be used for pursuing economic, environmental or social strands.
Rural development has several measures that fund training, the exchange of information, the use of advice and training of advisors, demonstration, farm exchange and piloting and testing new ideas as well as results from research in EIP operational groups (OGs).
The 2017 EIP evaluation study
, the Policy brief on Advisory services
from the SCAR
Strategic Working Group on AKIS and the recently concluded FP7-funded PRO AKIS project, the SCAR Foresight and the SCAR-AKIS reports
provide some background: the weaker and more fragmented the AKIS is in a country, the less actors are interconnected and the more difficult innovative projects such as EIP OGs emerge. It was observed that innovation under the EIP-AGRI is most successful in regions / Member States where a dedicated innovation environment is created and the AKIS is strong and integrated
.
The available information suggests
·Different Member States (MS) have different, mostly very fragmented AKISs responding to different historical developments and circumstances. Some links between particular AKIS models and the performance of those models are emerging6.
·The exchange of information between different parts of AKISs in MS and regions (advisory services, farmer organisations, research, educational systems, etc) needs to be improved. Networking and cooperation, in particular between research, advisors and farmers is crucial to allow for co-creation of new knowledge, and the rural networks should support this to a larger extent and in a more structured way supporting connections between all relevant geographical levels and actors.
·A system merely focusing on provision of advice is no longer sufficient. There is a need for continued public support to maintain and further stimulate the exchange of information within the agriculture sector, and in particular to enable an EU wide interconnected AKIS1, as started up under the EIP.
·The EIP approach of interactive innovation and co-creation via hands-on operational groups (RD), complemented by linking research and practice in networks and by funding Horizon 2020 interactive projects, is well appreciated by the sector. The EIP measure in rural development has been taken up successfully and is evaluated positively.
·The EIP-AGRI’s bottom-up and farmer-led approach is assessed "truly distinctive and highly appreciated by farmers and stakeholders", which demonstrates the need for its distinctive approach to innovation. "The flexibility of the EIP-AGRI allows it to tackle this and to be shaped to widely different circumstances"
. Therefore MS and Europe needs an “AKIS 2.0” (see EIP brochure
)
·The measures related to the advisory services under Rural Development face difficulties among others as a result of the rigidity of the measure (list of elements to be covered, need to apply public procurement rules etc) and the enhanced profiling of commercial businesses as “advisory services” providing advice “for free”.
EU value added
Currently, a few Member States have a well-functioning AKIS, whereas in most parts of Europe it is less provided for. One could argue that the AKIS is a national responsibility, where the EU does not have a role to play. However, the successful implementation of the CAP, in particular when it comes to innovation, requires well-functioning and EU wide interconnected AKISs. Therefore, the EU has an interest in ensuring that such an AKIS exists to address EU level objectives supports the realisation of CAP objectives.
Secondly, the EU has a role in complementing the national and regional AKIS systems and to ensure that information is exchanged between different Member States about new technologies, new ideas for marketing, land management, management and preservation of public goods etc. This is a part of the EIP that is particularly appreciated, also by farmers.
Finally, the CAP can make synergies with EU research policy and results. This can help co-creating new knowledge responding to farmers' needs in a more cost-efficient way through the multi-actor approach, and support making new knowledge available in all parts of the EU in a better organised way.
Policy implications
Any new policy on AKIS should create EU added value by:
·incentivising interactive innovation projects (CAP policy – dedicated knowledge and innovation actions creating new knowledge – EIP OGs)
·organising and structuring knowledge exchange at national / regional level, as well as at EU level (CAP policy – networking, advisory services and information actions).
·pooling resources to address EU level objectives (EIP networking activities, Research policy, in particular multi-actor research projects and Thematic Networks)
·maintaining / reinforcing the links between the CAP and the new Research and Innovation Framework Programme 9 (FP9) and possibly other policy areas (ESIF, LIFE, national and regional research). In particular, continuing to reinforce the links between the CAP and FP9 will be key to boost synergies between the 2 policies and build a comprehensive research and innovation system in agriculture in the wide sense of the word
·being flexible enough to address national differences
In view of the EU value added, EU support should be focussed on the areas where EU intervention can make the difference. The fostering of knowledge exchange and innovation should be linked to EU level objectives and a related performance framework with clear reporting obligations.
Innovation can be a central objective to be achieved in a programmed approach by Member States / regions. Member States and regions would programme knowledge hubs, interactive advisory services and other elements of AKIS with a view to achieve innovation.
The support would focus on ensuring the exchange of information and ideas in projects but also at national / regional level and at EU level. The EIP experience has demonstrated that the Commission can steer Member States' attention towards innovation via the interactive approaches (the EIP network, high co-financing rates for knowledge and innovation projects for EIP OGs) and sufficient flexibility to adapt to the existing AKISs.
·The CAP Plans should have an obligatory section where each Member State explains how it is going to stimulate knowledge exchange and innovation. Specifically, the CAP Plan will have to provide information on how advisory services, research and rural networks will work together and on how innovation support services will be provided. The scope of the knowledge exchange and innovation should cover agricultural issues at large and the wider rural community (including environment climate change, energy, agri-food or bio-based value chains and the creation of possibilities for rural businesses).
·Under the CAP Plan each Member State or region funds a number of actions related to information actions, demonstration, farmers' exchange, training, advice, pilot projects, EIP-AGRI operational groups, etc. aimed at knowledge exchange and innovation, using the types of intervention to be developed in the regulation.
·Beyond the CAP, delivery on knowledge and innovation will be conditional on the capacity of the FP to fund the necessary knowledge generation and communication at EU level. This will be achieved only if the synergies that have been established between the CAP and Horizon 2020 to establish a comprehensive agricultural research and innovation ecosystem will be maintained and/or reinforced in FP9. Ambitious R&I activities need to be developed under FP 9 to promote food and nutrition security and the sustainable management of natural resources, building on the Strategic approach to EU agricultural R&I, the EU Bioeconomy Strategy, and Food 2030.
2.
Strengthening of farm advisory services within the Agricultural Knowledge and Innovation Systems
The Communication mentions the exchange of knowledge and focus on innovation is a cross cutting objective for the new CAP. The CAP should continue to support the interactive innovation model, as applied in EIP Operational Groups and in H2020 multi-actor projects and thematic networks. In essence, this model stands for tackling real practice needs/opportunities through collaboration between actors to make best use of specific complementary types of knowledge (scientific, practical, organisational, etc) in view of co-creation and diffusion of solutions/opportunities ready to implement in practice. Farm advisory services should be strengthened within the AKIS. The farm advice given should be impartial, advisors should have no conflict of interest with commercial activities.
The current legal framework obliges Member States to have a Farm Advisory System (FAS) in place. However, the use and uptake of the knowledge and advice measures remains limited in the current programming period. The EIP-AGRI initiative has led to considerable attention for innovation and the exchange of knowledge. Horizon 2020 projects and CAP interactive innovation projects have helped bringing in new knowledge and compiling knowledge ready to use and also by connecting Horizon 2020 to EIP funded projects. The EIP-AGRI aims to ensure better uptake of results of H2020 projects through the multi-actor approach which produces practice-oriented recommendations in a language easy to understand for farmers/foresters and advisors. These recommendations are then communicated through the EIP website and EIP networking activities.
In the current CAP period, it is observed that innovation under the EIP-AGRI is most successful in Member States where a dedicated innovation environment is created and the AKIS is strong and integrated
.
The efficiency and effectiveness of advisory services can best be upgraded by improving their connections within the Agricultural Knowledge and Innovation Systems and sharing knowledge and innovative applications more intensively. To perform such an upgrade of advisory services, a transition period is needed. Such a transition plan will form a part of the CAP Strategic Plans to be approved.
Context
·Traditionally advisory services were used to "transfer" knowledge to farmers in order to make them perform better. Knowledge no longer only flows in one direction from research to farmers. Nowadays challenges have become much more complex and knowledge is less concentrated, therefore this " linear" knowledge transfer model is failing.
·The linear model meanwhile has been complemented by the so-called "interactive innovation model" as applied in the EIP-AGRI. This model puts the emphasis on targeted knowledge “exchange" because there is a need for co-creation of new and tailor-made solutions which are combining different kinds of knowledge. To enable this, collaboration between specific combinations of actors who can bring in the various types of knowledge (scientific, technological, practical, organisational etc.) to solve the problem needs to be incentivised. Advisors obviously play a key role in the interactive innovation model.
·Consequently, there are more players that have to be involved in the sharing and creation of knowledge. Therefore, the focus is now on improving information flows within the Agricultural Knowledge and Innovation Systems (AKIS), the systems of people and organisations in MSs/regions that generate, share, and utilize agriculture-related knowledge and information (e.g. administration, researchers, advisors, farmers, agri-business, etc.).
·An advisor is as strong as his/her interconnections within the AKIS are. He/she needs to be fed with the newest knowledge and be supported to develop knowledge in interactive innovation projects such as in the EIP (H2020 multi-actor projects or RD Operational Groups). The advisor furthermore plays a key role to funnel farmers' needs and opportunities into the knowledge and innovation system for further development. This helps knowledge systems to improve their impact. Therefore it is useful to support strengthening of farm advisory services within the AKIS. To adapt to the diversity of AKIS systems in countries, flexibility will be needed, to the example of the EIP implementation.
·The FP7 PRO-AKIS study showed that it is of utmost importance to support solid transition plans for the strengthening of farm advisory services within the AKIS, in order for countries to improve and learn from best practices from other MS, or to make what remains of advisory services – if any - gradually more competent and inclusive. Researchers will also need to be incentivised and rewarded to share research results within the AKIS. (See further context in the SWG SCAR-AKIS Policy Brief on the future of advisory services
).
·The funding and organization of future advisory bodies should be made resilient through a mix of public and private funding. The Policy Brief on the future of advisory services (SWG SCAR-AKIS, Brussels, 2016) mentions a front-office / back-office approach. The back-office, that should be public funding, will insure the managing and keeping the knowledge public, make it easily available, actively build networking activities, enable thematic orientation and feed in of collective intelligence from multiple sources
. The front-office, mainly private funded, will deliver on-farm advice, will take in questions and guide them, if necessary, to the specialists in the back-office.
3.
Enhancing interactive innovation
In line with the Communication on the Future of Food and Farming, the CAP will be able to both continue backing farmers’ income and contribute to a more sustainable development of EU agriculture.
So far, in the period 2014-2017 very positive experience has been gathered by the EIP "Agricultural Productivity and Sustainability" with regard to speeding up innovation and fostering competitive and sustainable farming and forestry that 'achieves more and better from less'.
To enable impact from projects, the basic concept of the EIP-AGRI is
(1) to focus on end-users’ problems/opportunities and
(2) to have partners with complementary types of knowledge – scientific, practical and other - joining forces in project activities from the beginning till the end.
This is called the "interactive innovation model" and is essential to tackle current complex and systemic challenges with good results. These interactive projects are able to develop innovative solutions which are more ready to be applied in practice and cover real needs. Moreover, end-users like farmers, foresters or businesses will be more motivated to use the project results, because they were involved in generating them and feel "co-ownership". The ultimate aim of the EIP-AGRI is to ensure a steady supply of food, feed and biomaterials with dedicated attention to include the relevant actors in the chain (farmers, advisors, researchers, education, businesses, NGOs, authorities etc). Advance payments and a specific framework for reporting, evaluation and control practices, distinct from other CAP payments, to the example of projects under EU Research Policy, will be needed to incentivise also smaller actors to lead and join EIP projects.
The EIP-AGRI applies the interactive innovation principle under EU research funding (the so-called ‘multi-actor approach’: 1 bio Euro multi-actor projects in 2014-2020 under H2020) and under CAP funding in Rural Development Programmes (the so-called 'EIP Operational Groups': 3200 planned in 2014-2020 and a number of cooperation projects focusing on innovation).
Besides the interactive projects, the EIP-AGRI also supports the EIP network which connects people and projects, both at EU level and at national/regional level. The EIP-AGRI network is run by the European Commission (DG AGRI) with the help of the Service Point (SP). The SP team facilitates the networking activities, enhancing communication, knowledge sharing and exchange through conferences, focus groups, workshops, seminars and publications. The primary target is to stimulate the interaction between all actors. This creates great spill-over effects through knowledge sharing and cross-fertilisation of ideas between CAP and H2020 funding.
In practice, a unique EU repository of data from the projects enables the actors from both H2020 and CAP innovation projects to connect and be informed on which innovative project is taking place where. For instance, this repository enables the 6-7 February 2018 EIP workshop on innovative supply chains, where more than 40 EIP OGs convened and exchanged information between each other. They were at the same event connected with 9 H2020 multi-actor projects (and other projects) concerning innovation in food supply chains. Not only information was exchanged but also first steps for further innovative cooperation and projects were taken and ideas for further research collected.
A thriving innovation ecosystem is important to incentivise innovation projects: raising awareness and animating the participation in innovative actions are key for the successful implementation of the EIP. A lot of existing networks and platforms can contribute to connecting stakeholders and to preparing and discussing potential innovative ideas. Part of the action plan of National Rural Networks (NRN) focuses on thematic and analytical exchanges between rural development stakeholders: the NRN or national EIP network funded with Technical assistance is expected to foster innovation. Under Art 35 of Regulation (EU) No 1305/2013 also new networks can be funded, e.g. regional or national EIP networks, or thematic networks. For incentivising actions of operational groups, it makes sense to exploit all available means within the existing AKIS and involve existing networks/clusters wherever possible and useful, in particular linking up researchers and advisors as inclusive as possible to the rural networks in order to get knowledge flowing across Europe.
Innovation support services, besides providing innovation brokering services, can help promoting innovation and innovation funding formats, organise brainstorming events and animation of thematic or cross-sectoral groups, coordinate and facilitate projects as an intermediate between partners bridging between science and practice, and support broad dissemination of innovative project results.
Working with intermediates in the EIP operational group project, so–called “facilitators”, is important in view of getting and keeping the discussion on the farmers’ problems and bridging between the language of science and entrepreneurial practice which may have different objectives and time horizons.
Roles of Innovation Support Services
·act as an “innovation broker” putting farmers/foresters in touch with the people they need to work with and vice versa (e.g. researchers, advisors, businesses in the food and non-food supply chains, NGOs, administration, consultants etc.). This should enable them to share information, find the solution to an issue identified or to realise a specific new approach or idea they have (innovation opportunity)
·can act as " innovation facilitator", an intermediate function bridging the gap between research and practice, or other actors, and helping innovation projects run more smoothly and achieve results.
·should actively promote the benefits of collaboration to foster interactive innovation and facilitate the dissemination of information about innovation projects/approaches in agriculture and forestry
·form part of a wider package of support for innovation. The service provider will be expected to work closely with others (existing networks, organisations) to ensure a joined up and synergetic approach is take.
·are expected to work with the national/regional rural networks and other relevant organisations to help groups carrying out innovation projects in agriculture and forestry to take part in Horizon 2020 and other EU funded projects and bring the innovative knowledge from the EU level or from other countries/regions to the own country.
Becoming an innovation support service is a new "interactive" role which advisory services could take up within the AKIS
. To this end they need to develop interactive skills and may need specific training. In this way they will acquire innovative knowledge linking CAP (innovation projects in particular and the rural networks working for innovation) with H2020 innovation (multi-actor) projects and working closely with existing infrastructure/networks.
Intergenerational renewal
Intergenerational renewal will be incentivised if the young farmer sees a attractive future based on a decent farm income. This often encompasses profound changes on the old farm. New farming methods, new products and technology, new outlets and supply chains etc. can be tested out in innovation projects where the young (and old) farmers join up with experts bringing inspiration, a neutral view and specific expertise, be it on business development, calculation methods, market or product knowledge or anything which can move them towards the necessary change to future-proof the farm for the young farmer. Innovation projects may focus on specific production methods, on more nutritious and valuable products, better connection between consumer and producer in short supply chains creating win-wins, internet sales, niche markets or certified products, promising non-food products and related bio economy value chains and so on, all promising avenues for young farmers to develop a better income on the farm.
4.
Supporting digital transition in agriculture
To make sure the potential of digital technologies is fully realised, there are 3 key areas of intervention:
1)The need to support the uptake of digital technologies by farmers and rural communities.
•Both on- and off-farm employment will require increasing levels of digital skills. According to the 2017 Europe’s Digital Progress Report
, 44% of the EU population and 37% of the workforce had 'insufficient' digital skills in 2016. Important is to consider the skills level of advisory services, in order to make advisory services able to help orient farmers in the digital landscape.
•There is a risk for having a digital divide. Small or less educated farmers may be unable to keep up with new technologies. This could lead to a large digital divide between big and small farmers. Therefore, having independent advisory services in place with sufficient digital knowledge and access to the data is very important to help to minimise the divide.
•Independent advisors often lack digital skills. As agricultural data management and precision agriculture requires technical competence, a system of support and training for advisers across the EU would be very much desirable. The future role of farm advisory services should include facilitating innovation projects on digital technologies and supporting farmers in orienting themselves in the digital landscape.
•There is a lack of infrastructure, many rural areas lag behind in broadband availability, while 76 % of the EU population has access to fast broadband (>30Mbps), only 40 % of homes in rural areas have such access.
2)The development of digital solutions based on existing and new technologies.
•There is a core group of digital applications which on big farms found already wide adoption (e.g. digital application, GPS positioning, milk robots, etc.), but many other applications are still to be developed.
•There is a need to develop adapted solutions for all including small farms. There is still a high need for incentivising innovation, to tailor digital technologies to farmers’ needs.
3)The need to deal with the impact of digital technologies in the society and ensure that existing policies can mitigate potential negative effects coming with digitisation.
•Technology is neutral; its different applications are not. Empowerment of farmers and the provision of better and increased support for impartial advisers are needed to overcome the perceived complexity of precision agriculture solutions. With strategic targeting of policies, the positive effects of digitisation can be achieved, while the negatives can be mitigated. In other words, different emphases in the CAP might direct the development and impacts of digitisation (e.g. simplification of administrative processes and certification, increasing environmental ambition, attention for advice and small farms, etc.)
.
-In addition, in the context of ISSG on modernisation and simplification of the CAP, DG AGRI and DG CNECT launched jointly the pilot project RUR-14-2018: Digital solutions and e-tools to modernise the CAP
The project should achieve a further integration and digitization of the EU CAP's governance infrastructure, by:
·evaluating the reduction of the socio-economic costs and – barriers for a wide range of stakeholders involved in the implementation of the CAP;
·improving the potential of IACS to be used for monitoring, analyses and control, by incentivising administrations to share part of their national LPIS information;
·achieving a higher level of system interoperability and (meta-)data standardisation, allowing innovative ways to use and combine agri-environment-climate data;
·achieve user acceptance validation addressing privacy, security, vulnerability, liability, identification of user needs.
In the long term this pilot could contribute to a more inclusive, efficient and sustainable EU CAP. For instance, a digital farm dossier organising the data gathering and sharing through the whole supply chain can lead to a major simplification of the CAP administration, monitoring and management systems. At the same time, it could also lead to significantly reducing farmers' administrative burden towards cooperatives and private retailers asking for certification, together with the building of efficient learning networks useful for cross-policies implementations.
A set of projects will be funded under the 2018-2020 H2020 Work programme to support the digital transition in agriculture (Total 102 mln €, see Annex 3)
•
RUR-02-2018: Socio-economic impacts of digitisation of agriculture and rural areas
•
RUR-13-2018: Enabling the farm advisor community to prepare farmers for the digital age
•
RUR-14-2018: Digital solutions and e-tools to modernise the CAP
• DT-RUR-12-2018: ICT Innovation for agriculture – Digital Innovation Hubs for Agriculture
• DT-ICT-08-2019: Agricultural digital cross-cutting integration platforms
• DT-ICT-09-2020: Digital service platforms for rural economies
Annex 6.1: Characterising MSs’ AKISs
Annex 6.2: Report of the European Parliament
A recent report of the European Parliament
addresses a number of issues related with the digital transition in agriculture which can be tackled through well designed research, advice and innovation actions:
“While it is clear that the farmer owns the data generated on his fields, with increasing amounts of data being created about farming and by farmers, the identification of the different forms of field level data on yield and input performance being generated by the technology has become an overriding issue that remains relatively unexplored”. "Pointing out that data can be a valuable commodity in its own right, the study warns that its misuse could have far-reaching consequences: “Data combined with other farm data can be crunched, tweezed or bludgeoned into showing trends, predict market futures or the adoption of new crop technology. Thus, its potential misuse could lead to anti-competitive practices including price discrimination and speculations in commodity markets that may affect food security especially in Europe.”
"Precision agriculture also raises questions in relation to the terms of interaction between humans and machines – particularly regarding the lack of independent advisory/consultancy services. Given the technical complexity of precision agriculture, its use and operation require the provision of advisory/consultancy services specialised in data management. Such specific services would probably not be independent, and may generate competition and fragmentation with regard to current farm advisory services providing comprehensive and impartial advice for farmers. Farm advisory services and the European Innovation Partnership enable support for the uptake of new technologies, new management approaches specific to local conditions and tailor-made solutions. If Member States programme the advisory measure, farmers can be funded for the use of expert advice and the necessary knowledge and information required for implementing farm operations. Farm advisers play a central role in recommending, delivering and giving support to farmers on new data management technologies, including precision agriculture. The increasing use of precision agriculture creates an additional challenge for established farm advisory services. Farmers should be enabled to receive personalised, targeted advice based on the information/data they own and provide to their adviser. To this aim, common data standards are needed and farm advisory services will need dedicated tools and training on agricultural data management." "Also, open-source environmental, geographic and satellite imagery data should become accessible to advisory schemes allowing the latter to develop balanced information dissemination without bias or special interests. The farm advisory services in Member States can in principle play a special role in supporting precision agriculture, providing support and advice to farmers regarding technology and precision agriculture methods as an independent body not linked with commercial companies."
Given that precision agriculture is currently almost entirely based on the private sector offering devices, products and services to the bigger farmers who can afford it, public service advice is generally very limited. In the majority of Member States, access to independent advisory services linked to public bodies, co-operatives and farmer associations, where the farmers can get additional information in order to make decisions, is limited and rather unstructured. The role of independent advisers, who can combine agricultural and environmental understanding, is critical as they can be consulted by farmers as impartial sources of knowledge and experience, rather than private company consultants whose role may for instance include product sales as a condition for their support."
"A new 'big data digital divide' as a form of economic and social inequality may emerge as farmers most often lack the tools or the context to analyse their own data and are mostly unaware of the extent to which their data get stored, traded and analysed for future use. In particular, one of the main restrictions for data sharing among institutions, farmers, advisers and researchers is due to non-standard software and data formatting solutions."
"A new farm information management system may need to be developed, that could facilitate instructions to operators, the certification of crop production process and cross compliance of standards. Farm advisers will be needed to analyse the data of a farm and help farmers, both large and small ones, to know more and understand the added value of managing their data in an effective way (e.g. about the nutrient balance of their soil). All farmers should benefit from that, not only those that can afford to pay for the services of private advisers. Simply making data available is not enough to address these differences, and more needs to be done, potentially through providing low-cost advisory services on data use. Combining public data with the farmers' own data, possibly supported for the analysis by independent advisers, can help small and medium farms to make better use of data and improve their insight in the farming and market processes with a view to supporting competiveness and improving sustainability. The combination of public data and farmers' data can support a level playing field for an agricultural data 'ecosystem' for all farms. The development of data exchange for the precision agriculture information systems based on EU common standards may address the problem of digital division."
Therefore the report, which is advisory in nature, calls for the establishment of what it calls “an EU-wide independent, farmer-centric data repository” to ensure safe and proper access to data generated by precision farming. The geospatial data already collected in the framework of the CAP payments, and existing EU standards linked to this system, may provide a good base for developing this data repository,” the report’s author suggests. “Moreover, such an EU-wide repository has a huge potential for administrative simplification, both for farmers and for Member State administrations. It could also enable a set of synergies with applications related to, for example, traceability of food, certification schemes (organic production, geographical indications), research and innovation projects, etc. The not too distant future will provide even more opportunities for capturing and sharing data at an EU scale.”
However, a concern debated in the new report is that of access of precision farming tools for smaller-scale producers. “Small farmers may be unable to keep up with new technologies because of lack of knowledge or investment capital. This could lead to a large digital divide between big and small farmers,” it warns. The report suggests that one way of addressing this problem could be to incentivise Producers' Organisations (POs) to organise access to precision farming for its members, with the support of Common Market Organisation (CMO) funds. This, it suggests, may prove more accessible for small farmers than existing grants for technological innovation under Pillar Two of the CAP.
Annex 6.3: H2020 projects supporting the digital transition in agriculture (2018-2019-2020)
Annex 6.4: H2020 "Thematic network" projects compiling knowledge ready for practice (2014-2017)
Themes rather sector-oriented (2014-2016):
Themes rather cross-sector oriented (2014-2016):
2017 Thematic networks:
Annex 7: Simplifying the CAP
Glossary
|
Term or acronym
|
Meaning or definition
|
|
AECM
|
Agro Environment and Climate Measures
|
|
AKIS
|
Agricultural Knowledge and Innovation Systems
|
|
ANC
|
Areas facing Natural Constraints
|
|
BAS
|
Baseline
|
|
CAP
|
Common Agricultural Policy
|
|
DP
|
Direct Payments
|
|
EAFRD
|
European Agricultural Fund for Rural Development
|
|
EAGF
|
European Agricultural Guarantee Fund
|
|
ESI
|
European Structural and Investment
|
|
GAEC
|
Good Agricultural and Environmental Conditions
|
|
GI
|
Geographical Indication
|
|
ICT
|
Information and Communications Technology
|
|
IPR
|
Intellectual Property Right
|
|
ISCO
|
International Standard Classification of Occupations
|
|
LPIS
|
Land-parcel identification system
|
|
MCA
|
Multi Criteria Analysis
|
|
MFF
|
Multiannual Financial Framework
|
|
PDO
|
Protected Designation of Origin
|
|
RD
|
Rural Development
|
|
REFIT
|
Regulatory Fitness and Performance
|
|
SMR
|
Statutory Management Requirements
|
|
SWOT
|
Strengths, Weaknesses, Opportunities, and Threats
|
|
VCS
|
Voluntary Coupled Support
|
1.Administrative burden under the CAP
Simplifying the CAP has been a long standing objective. It is generally felt that the implementation of the CAP is cumbersome both for beneficiaries and for national administrations. In particular, the complexity of the CAP and its structure along 2 pillars with multiple tools and measures makes it difficult to have an overall coherent and comprehensive understanding of the CAP. This complexity is largely related to the historical development of the CAP and its tools. With new needs arising, the CAP has evolved, adding up new layers to the existing ones. This has resulted in a complex system of basic mandatory tools complemented by a high number of voluntary ones, with a high level of details set at EU level and a range of exceptions and derogations introduced on request of Member States. Though several reforms strived already to address administrative burden, today's CAP implementation still remains complex, costly and burdensome.
The annual administrative costs for national administrations are estimated at 4.8% of the total public expenditure under the CAP budget. This includes costs for management and control of the CAP expenditure, i.e. the delivery costs, and hence excludes any one-off set-up and adjustment costs. The 2017 report on ESI Funds confirms this conclusion with 4.7% share of administrative costs under the rural development programme. Programming ESI Funds at regional level is assessed to entail proportionally higher costs with regard to the budget.
Graph 1 Estimated share of selected cost categories for national administrations under the 2014-2020 RD programming period
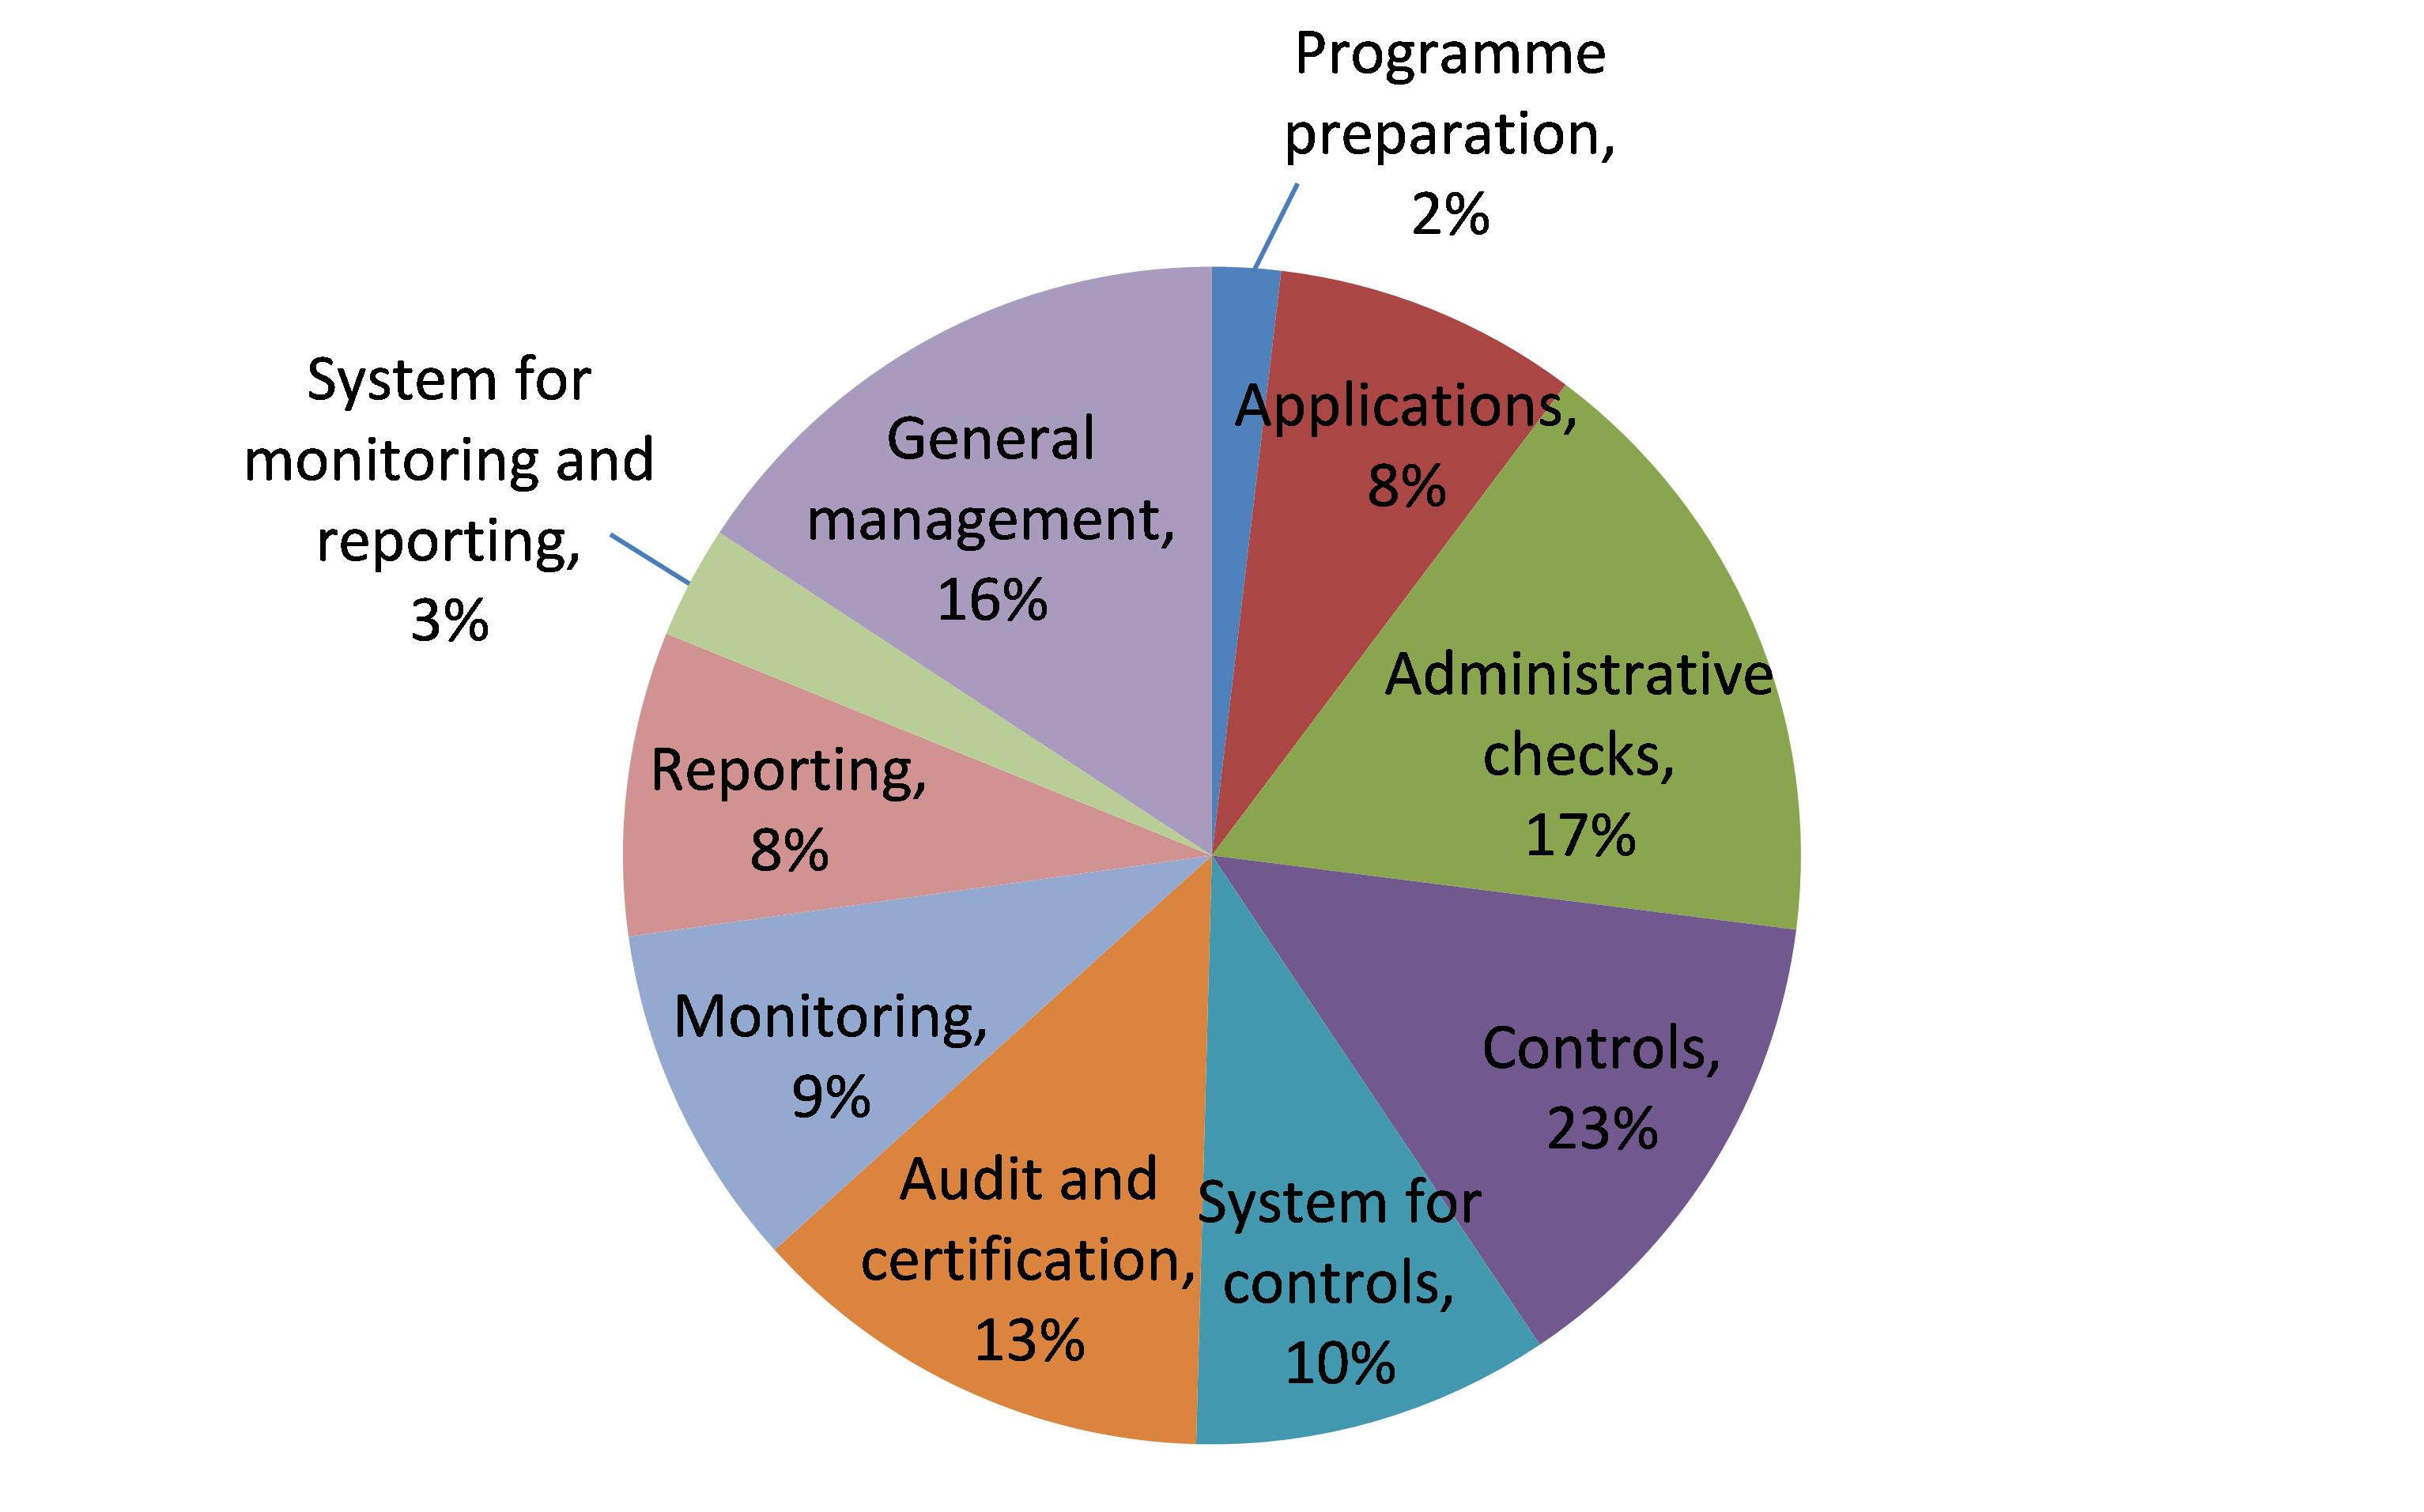
With regard to beneficiaries, costs related to rural development measures were estimated in 2011 at 4.7% of total public expenditure (including national co-financing), or 6.6% of the EAFRD expenditure. This is comparable with the 2006 estimations of administrative burden for farmers linked to the CAP direct payments (3% to 9.3%, depending on Member States). The 2011 study on administrative burden finds that applications represent almost 80% of the administrative burden for beneficiaries, compared to 19% for payment claims and 2% for cooperation with authorities in the frame of on-the spot controls. While information obligations are generally not significantly different in function of the amount of area or animal-related payments, the administrative burden on beneficiaries is proportionally higher for small amounts. While the burden varies significantly between the measures assessed, information obligations under project-related measures are the most burdensome for the individual beneficiary.
Findings from the report on implementation of the 2013 CAP reform indicate overall variable administrative burden from the various direct payment schemes and rural development measures. The evaluation on viable food production reports that the proliferation of measures is also driving higher administrative burden, possibly disproportionate when few beneficiaries are targeted by the measure. For direct payments, high burden is particularly reported for on-the spot controls, except cross-compliance where controls are often combined with sectorial checks. Beneficiaries also experience high burden with relation to the eligibility requirements, i.e. declaration of land cover and use of parcels. Greening and VCS are recurrently set forward as more burdensome tools, although for VCS this largely depends on Member States' choices. Some additional findings identify high administrative burden perceived for the implementation of the "active farmer", the verification of payment entitlements for young farmers. For rural development measures, high burden for national administrations occur with regard to the transposition of eligibility criteria and EU requirements, and the administrative checks of applications and investment projects. Thematic sub-programmes are also reported to add up significantly to the administrative burden. Similarly to direct payments, eligibility criteria create high burden for beneficiaries, as well as administrative checks.
Each reform is also bringing its set of adjustment and investment costs. Investment costs typically occur only once, such as implementation costs, the set-up or update of IT systems and definition of new procedures. Adjustment costs refer to the temporary loss of efficiency due to the reorganisation within the administrations and are characterised by high costs in the early years after the reform, then decreasing over time. This includes costs linked to training and familiarising with the information obligations. If excessive, one-off and adjustment costs may counterbalance the administrative burden reduction achieved by the policy changes. Findings of the 2006 study on administrative burden on farms revealed that one-off costs in France for implementing the 2003 reform on decoupling payments were slightly higher than the recurring costs of that year. The 2012 LEI report on the simplification of the CAP sets in perspective the potential burden reduction of the 2013 CAP reform proposals considering also investment and adjustment costs. Under the 2014-2020 rural development programme, one-off costs are estimated to represent between 15% and 20% of total administrative costs under the programming period.
The 2016 report on CAP implementation also assesses that typically about 50% of administrative burden from Pillar I derives from the implementation at national level, while this represents 85% for administrative burden related to Pillar II. Actually during implementation process Member States can generate significant additional administrative burden during transposition of EU requirements into national legislation or through so called gold-plating. Complex, incomplete or ambiguous national legislation can lead to inefficiencies and confusion. This translates in significant time loss to interpret rules and understand requirements, and can lead to higher error rates. Gold-plating typically results in another layer of systemic complexity as such detailed or disproportionate requirements and excessive documentation requests translates in increased administrative burden for beneficiaries and national administrations also with regard to applications and controls. The study of the European Parliament on gold-plating in EAFRD reports an excess in administrative or procurement rules related to the eligibility criteria and to cross-compliance. The burden on beneficiaries from gold-plating is estimated at 35% of the total burden. The High Level Expert Group monitoring simplification for ESI Funds concluded, based on evidence from the 2017 report on ESI Funds, that the main reason for gold-plating is the fear from national authorities that their action would be challenged later or that the auditors might disagree with the solution chosen by then.
Finally, complexity in both EU and national legislation typically translates in higher hassle costs, which is the cost associated to time lost by waiting, e.g. for approval of programmes or for payments. The synthesis mid-term evaluation of the 2007-2013 rural development programmes reports that the administrative challenges have caused significant delays in the start of programmes in a number of countries. This is also confirmed in a special report of the European Court of Auditors, which estimated at over 11 months the average time for approval of the rural development programmes, largely related to the complexity of the programmes and the resulting delays for approval by the Commission.
Altogether, a wide range of inefficient procedures for management of specific CAP measures have been highlighted over the last years by the European Court of Auditors in their special reports. These reports provide recommendations for a more efficient management of the CAP tools: better targeting of funds to needs, improving selection of rural development projects with regard to their cost-effectiveness, enhancing synergies between tools, limiting risk of errors due to the complexity of the rural development framework, improving the monitoring and evaluation system (including quality and adequacy of data). The lack of appropriate tailoring and targeting of CAP tools under DP and RD was further assessed in the 2016 report on CAP implementation: the analysis looked at whether a suitable enabling environment was implemented. It concluded that Member States choices did not systematically set the necessary preconditions for the CAP to be effective especially with regard to sustainable growth.
The recent Court of Auditors' report addressing design and process of the 2014-2020 programming framework under Rural Development, observed that the new results-oriented approach enshrined in the strategic framework had a limited impact due to shortcomings in the implementation. For example, the programmes' contributions to the Europe 2020 Strategy were difficult to assess. The setting-up of performance indicators unveiled limitations. The report recommends improving the consistency between individual programmes, simplifying programme requirements, more meaningful measuring and annual reporting on the implementation, and legal clarity for the next programming period in good time. This report also considers that the principles of strategic programming and result-orientation are valuable and deserve further refinement also in view of a simpler implementation in practice.
Following the submissions for simplification received, the REFIT Platform expressed the need to reduce the regulatory burden of the CAP and improve its value for money, while ensuring the achievement of the objectives and increase its integration with other policy areas. The REFIT Platform opinions concern especially the efficiency and effectiveness of the policy. The platform pointed at overlaps between both CAP pillars due to new and increased greening of Pillar I, resulting in a risk of additional compensation and administrative burden. The platform proposed to revise the cross-compliance rules in order to create greater transparency and proportionality, particularly for the penalty system, and to assess the link between cross-compliance rules and agro-environmental commitments. The platform mentioned the inconsistency of certain ESI Funds and EAFRD rules and proposed the harmonisation and standardisation of ESI Funds. An opinion on control and audit of the CAP suggested establishing more targeted, risk-based and proportionate control regimes.
Responses to the 2017 open public consultation on modernising and simplifying the CAP confirmed the general perception of excess of bureaucracy: the greening scheme, aid applications and controls are identified as the most burdensome and complex elements. The call for a reduction of administrative burden is a generalised demand in the papers submitted by farmers and national administrations. There is a clear agreement among stakeholders on the positive effects of reducing the overlaps between Rural Development and other CAP measures (69%), the better use of databases and technologies (remote sensing, smart phones) to reduce farms inspections (62%) as well as the use of a more extensive use of e-government tools (63%).
Some issues have also been raised with regard to the Common Market Organisation. Producers and Member States have asked for the system of geographical indications (GIs) to be more efficient. Under current procedures detailed analysis made by Member States is to a large extent duplicated by the Commission. The administrative burden is causing delays in registration of GIs which reduces the system’s credibility and raises questions about the management efficiency. Lengthy procedures and delays in the registration process have been the source of regular complaints by the sector and the Member States.
2.CAP simplification and modernisation: changes considered for post-2020
For the next MFF, simplifying the CAP has been set as a main cross-cutting objective. The corresponding specific objective is to streamline the CAP design and delivery on EU objectives of relevance for the CAP including simplification. The three operational objectives under simplification to which each of the options under the impact assessment can contribute are:
·Shift from compliance to performance
·Reduce the administrative burden
·Enhance the proportionality of administrative costs
2.1.The new delivery model
To address the CAP objectives, the CAP post-2020 modernisation and simplification will introduce a new delivery model based on increased subsidiarity in the implementation and greater focus on performance. Under this new system, the Commission aims for enhanced coherence among the different instruments of the CAP. This is translated in the streamlining of direct payments and rural development as well as the sectorial strategies under the common market organisation in a unique and integrated strategic planning approach. At the same time, more flexibility is given to Member States in the design of the specific measures to better target national and regional needs, while justifying for a strategic approach and contribution to performance along EU objectives.
The definition of possible common rules applicable to all ESI Funds under a common rule book is currently being discussed between relevant services of the Commission in order to maximise coherence while keeping the specificities and needs of each policy. This document is prepared under the assumption that the outcome of these discussions will eventually allow for sufficient subsidiarity and focus on results, and the new CAP delivery model will fit well with the overall policy design of shared management funds.
From the perspective of simplification, the new delivery model has the potential to address some of the key issues identified above, such as the simplification of the rural development programming, fewer burdens from implementation of EU requirements through better adaptation to local situations and better coordination of the actions of the two pillars. It can also bring benefits in terms of policy coherence with the objectives of EU environmental legislation and the environmental planning tools.
The new delivery model will hence bring tangible changes to the current working methods of national and EU administrations: national competent authorities will have an increased responsibility for setting up a strategic approach for CAP delivery, under approval of the Commission. This will per se lead to certain administrative burden when establishing their CAP plan and justifying the choices made. However, national plans more specifically addressing national and regional needs can also positively impact the acceptability of the CAP and in consequence positively impact the perception of administrative costs. The role of the Commission will shift from setting up detailed rules and controlling compliance towards assessing national CAP design, delivery and monitoring on the basis of their performance.
The flexibility given to Member States leaves uncertainty as to the choices which will be made by Member States to implement CAP measures on their territory. It is therefore difficult to assess these impacts on administrative burden of the new delivery model at Member States level. While the streamlining of the CAP and the shift towards performance provide for significant potential for administrative burden reduction, the tools which Member States will take up in their national strategies as well as the national requirements and criteria will be key. There is indeed a risk that Member States continue focusing on compliance by setting complex, additional or even unnecessary national requirements. Nevertheless, fewer EU requirements will limit the fear of non-compliance with them by Member States, reducing therefore the incentives for gold-plating and for establishing numerous national rules. Likewise, the uptake of new technologies by Member States, such as digitisation and use of satellites, will have an important impact on administrative burden. The generalisation of the geo-spatial aid application and of single pre-filled application forms, mandatory from 2018 onwards, is already expected to simplify procedures.
With regard to beneficiaries, benefits in terms of administrative burden will derive from the national CAP Plan and the way national administrations translate it at beneficiary's level. A simpler, more coherent and strategic approach, if taken up by Member States, should result in reduced burden for applications and controls. Moreover, targeting the CAP to national and regional needs will enhance the acceptability of the CAP by beneficiaries, with a subsequent impact on perceived administrative burden.
2.2.Changes under the Common Market Organisation
2.2.1.Wine provisions
Two main changes are considered under the wine provisions:
•Planting authorisations: currently, new authorisations which may be granted under the system of planting authorisations (2016-2030) are limited by 1% of the area planted in the preceding year. Member States will have the flexibility to choose a fixed reference year instead (i.e. 2015, the last year of the old system). The main purpose is to maintain the production potential in those Member States where the vineyard area is actually declining, due to abandoned vineyards not being replanted.
•Oenological practices and vine varieties: the categories of low alcohol and alcohol-free wine will be included in the wine definition and the use of hybrids for the production of Protected Designations of Origin (PDOs) and the possibility to integrate non Vitis vinifera varieties (e.g. Vitis Labrusca) in their national list of wine grape varieties will be allowed. The main purpose is to a) respond to consumers' growing demand and match international competition on low alcohol wines and b) achieve a positive impact on environment ensuring better adaptability of vineyards to climate change due to the characteristics of these grape varieties.
2.2.2.Geographical indications
The Communication on the Future of Food and Farming called for geographical indications (GIs) to be made more attractive to farmers and consumers, and render the system easier to manage. Both Member States and the producers consider that the rules on managing GIs, spread over four basic Acts are far from being easy to manage and delays are too long. They are looking for a simpler GI system, in line with international standards for GIs, and faster registration of geographical indications and efficient approval of amendments to product specifications. This will allow producers greater flexibility and response time in competing on the EU and global markets. Protection of EU GIs in bilateral trade agreements is a major EU objective that is not fully exploited if the registration system is too burdensome and opaque.
GIs can be made considerably easier to manage by separating intellectual property rules from other requirements laid down in the product specification like compliance with marketing standards and labelling rules. This would enable more efficient registration of a GI as an intellectual property right (IPR), aligning with international practice for GIs, while allowing the non-IPR issues to be addressed more effectively, whether through separate legislation (as for derogations from winemaking rules) or addressing possible market infringements through the appropriate channels with the Member State concerned. In addition, limiting the scrutiny of applications at EU level to checking them against manifest errors as well as habilitating Member States to decide on amendments that do not have impacts at EU level, would streamline approvals, shorten timelines, and prevent the current wasted resources arising from the fact that Member States are already examining the applications to ensure that the rules are respected therefore a second layer of scrutiny at the EU level should become leaner to respect the twin principles of subsidiarity and proportionality. This division of competence would allow the Commission to focus resources on the EU value added, which stems from ensuring that EU-level impacts of protecting a GI are examined while the Member States are best placed to examine national impacts.
Clarification of the definition of 'Protected Designation of Origin' for wines will enable producer groups to use new varietals needed in response to climate change, and allow proper justifications of applications in line with viticulture and oenological realities, thus reducing the need for revising of an application, and faster registration of a Protected Designation of Origin.
Simplification of some specific procedures, for example the opposition procedure, is envisaged to reduce bureaucracy and misunderstandings, and make the process more effective. These essentially administrative 'tweaks' to the procedures and rules that will further shorten the overall time needed from the submission of the application to a GI registration.
The simplification proposed for wine GIs will exacerbate divergences from the rules for agricultural products and foodstuffs, laid down in a second basic Act. If the above mentioned simplification effort applied also to agricultural products and foodstuffs, leaner procedures allowing for faster registration would bring benefits to producers of GIs in this sector, too.
Finally as regards simplification, a third basic Act applies to aromatised wines. Currently there are only five geographical indications for aromatised wines registered (out of 3350 geographical indications in total). Having specific implementing and delegated legislation is considered a substantial waste of resources. Applying the GI rules for agricultural products and foodstuffs also to aromatised wines would be a major simplification and reduction of administrative burden without impacting stakeholders' existing rights. A fourth basic Act applies to spirit drinks. With a view to align it to the Lisbon Treaty and achieve simplification at the same time, the Commission adopted a proposal in December 2016.
In the view of the recent trends in the sales of goods, the sector is asking for more efficient controls of geographical indications by customs, in transit and their protection as intellectual property on the internet. One critical innovation needed is to make available GI metadata and internet links to official right-holders so that Customs authorities can take action. This is in train and does not need legislative adjustment. However, extending GI protection to goods in transit would align with anti-counterfeiting strategies for other forms of IPR as well as requiring Member States to better collaborate and exchange information in support of existing IP enforcement initiatives on-line that often by-pass GIs. These elements would reduce counterfeiting and make GIs more attractive to farmers and consumers.
All in all, a simplified system could be more understandable to consumers, become easier to promote and lead to higher sales and thus increased farm incomes as the concept of geographical indications becomes better known. A simplified EU system could reduce the costs for the public purse of managing the system and the enforcement thereof.
3.A CAP oriented towards performance
The new CAP delivery model is designed to allow Member States to orient their national strategy towards performance in function of identified national needs. However the choice in the design and delivery of national plans should not solely focus on the effectiveness of interventions, but should consider whether these are oriented towards performance. This means that account should be taken of the capacity of the various tools to allow for results to materialise in relation to their specific objectives, with regard to whether they foster results and/or provide incentives to beneficiaries to perform.
The performance-orientation of the impact assessment options was assessed in function of their design. Under all options the CAP post-2020 modernisation and simplification brings a shift from compliance to performance, with CAP plans taking national needs into consideration for the design of the national strategy, reduced control of compliance by the Commission, and monitoring and reporting on output, result and impact indicators (with a possible update of the national plan).
Options 4a and 4b ensure high result-orientation linked to the certainty of results under conditionality while the eco-scheme and the incentives it provides to deliver on results benefit result-orientation under option 3a. Option 5 scores averagely as the prescriptive approach, through top-ups defined at EU-level, inhibits the focus of the design on national needs, which in turn may prevent the creation of results where needed most. Entitlements under option 3b similarly prevent the tools to focus on needs.
Graph 2 Performance-orientation of options
4.Scope for reducing administrative burden
4.1.Simplification under the new delivery model
4.1.1.CAP strategic plans
The implementation information to be submitted by Member States under the current CAP is heavy and differs significantly in terms of content, format and procedures. It requires Member States to send a number of the notifications of implementation of various schemes including GAECs, to prepare a rural development programme and to prepare sectorial strategies for fruit and vegetables, wine and apiculture. Further sectorial programmes also exist in a limited number of Member States for hops and olive oil. While management of direct payments is dealt with at national level (except for Belgium, where Flanders and Wallonia administer these separately), rural development programmes are set up in 7 Member States by regional bodies (Belgium, Germany, Spain, Finland, France, Italy, Portugal). In some of these Member States, a national plan is drafted in addition to the regional ones, e.g. Italy.
Altogether, this information represents thousands of pages to be submitted by national administrations. Rural development programmes are the most burdensome, with programming documents averaging almost 800 pages. The sum of notifications' forms under direct payment represents over 500 pages, of which about 10% to be submitted on an annual basis. For sectorial programmes, national strategies average between 40 and 70 pages. Although the preparation of the rural development programmes represents a significant burden for competent authorities in the first year it represents however a small fraction of costs for national administrations, at around 2% of total costs over the 7-years programming period.
Under the options assessed in the impact assessment, all of these obligations are replaced by a new comprehensive CAP strategic plan. The CAP strategic plan should fit well with the overall policy design of shared management funds. It will be implemented by the appropriate governance structures and will encompass an ex-ante assessment, a national/ regional strategy, description of interventions, financial planning and a performance framework for monitoring and evaluation. While similar to current requirements under the rural development programmes, the scope for planning will be much broader, also including Pillar I payments and sectorial programmes. The CAP strategic plan is however designed to be less burdensome than the current rural development programme as the level of detail will be much less and it ensures a structured and strategic planning within a single procedure.
The CAP planning will need to be done at national level (while respecting each internal Constitutional framework, e.g. Belgium). However it can be expected that Member States regionalising funds under the EAFRD continue preparing their plan, at least partly, at regional level while coordinating and accompanying these under a national framework. For these competent authorities, the planning approach may result in increased costs for coordination mainly linked to the wider scope of the planning.
The costs for carrying out the analysis of national needs (SWOT analysis) are not expected to vary significantly in function of the design of the plan. However, the complexity of the design will matter: the more interventions planned, the more eligibility criteria and/or requirements set and the more complex the tools chosen, the more time will be needed to set up the national CAP plan and to explain the choices made in Member State´s CAP plans.
The system of approval is expected to be simpler than the current approval of rural development programmes, though streamlined for the whole CAP and with a different focus: while current RD programmes are assessed with regard to eligibility rules, the justifications for the design will be key for approval of the CAP plans.
4.1.2.Management of applications and payment claims
Applications represent the bulk of costs for beneficiaries and involve significant costs for handling of applications by the paying agencies and managing authorities. This entails in consequence a large potential for administrative cost reduction.
Under the current CAP, beneficiaries largely benefit from a single application form for area and animal-related payments and are more and more able of using geo-spatial aid applications for defining areas. The 2017 study on ESI Funds also reports gains under the 2013 reform from simpler rules for revenue-generating projects (up to 2.6% for beneficiaries) and for extending simplified cost options to grants and repayable assistance (up to 1.6% for national administrations, up to 7.5% for beneficiaries). Further, the 2012 eGovernance study estimated an expected administrative burden reduction of 11% by implementing eGovernance systems to applications and payment claims under rural development.
While little changes are expected in the procedures for applications and payment claims, gains can however be reached for both beneficiaries and national administrations. While the compliance by beneficiaries with eligibility criteria is no longer subject to the assurance mechanism and conformity audits, there is scope for administrations to require less evidence from applicants with their applications submission and payment claims. The 2017 study on ESI Funds assesses that on average an application form for payments under the ESI Funds is over 30 pages, with almost 200 answer fields to be completed, 5 signatures to be provided by the applicant and 6 supporting documents to be attached. Similarly, the requests for payment claims are on average 6 pages with almost 100 answer fields, 3 signatures required and 7 supporting documents. For national administrations, 3 approval steps are needed from submission of payment claims before the payment is made.
The disappearance of payment entitlements under options 3a, 4 and 5 are also expected to translate in an additional reduction of administrative burden.
4.1.3.Audits by the Commission and controls
The current audit system by the Commission will significantly change under the new delivery model. The task of EU auditors will shift to annual performance clearance, reliability of data to the Commission in the framework of the annual performance reports, and governance structures, including basic EU requirements. Therefore, the significant reduction in EU requirements is estimated to have a substantial impact on the scope and time needed to cooperate with EC audits.
Expectations are similar with regard to administrative and on-the-spot controls performed by national administrations: the shift towards control of performance, the expected reductions of requirements at the level of beneficiary and the flexibility in setting up management and control systems in the Member States, have the potential to limit the administrative checks on compliance and lower the time spent on farms for on-the-spot controls. Controls under conditionality replace current cross-compliance principles, though complemented with greening practices. Controls at farm level by the Commission should no longer take place.
4.1.4.Monitoring and reporting to the Commission
The current reporting system consists in the preparation of the annual accounts of the paying agency (for financial clearance), the management declaration, the reporting on control data and control statistics, the annual implementation reports of rural development programmes and the evaluations of these programmes.
The new delivery model requires annual performance reporting on the CAP strategic plan, at Member State level, with regard to performance indicators and expenditure. The annual performance clearance, performed by the Commission, will assess the progress on the achievements towards the objectives of the CAP plan. A multi-annual assessment of performance, based on the annual performance reports, will report on result indicators and distance to targets.
Regarding monitoring, under the three options assessed, the shift from compliance to performance is resulting in a changed set of indicators to be monitored and reported upon. However, for requirements stemming from sectorial legislation enshrined in conditionality, there is no change in the indicators. The common new set of indicators, while significantly reduced in terms of output indicators, nevertheless encompasses new indicators. The latter are assessed to be more time-consuming to collect and monitor. However, where the data is readily available, it is not expected to increase time spent for monitoring.
Some additional costs can be expected from the increased need to coordinate monitoring at regional level and collect/combine regional data (where applicable).
4.2.Strategic design and delivery for administrative burden reduction
Considering the flexibility given to Member States, the national choices made in the design and delivery of the CAP will have a major impact on the resulting administrative burden. Variety of tools, more complex procedures, and detailed requirements will all come at higher administrative costs for national administrations and beneficiaries. These costs will hence need to be counterbalanced with their expected benefits.
Modernisation can here play an important role for further simplification without compromising on performance. The increased use of new technologies can significantly contribute to fewer burdens through the use of remote sensing imagery, sentinels/satellites images, smart e-solutions, geo-spatial aid applications, ortho-imagery, and drones. A separate annex covers the cross-cutting objective of modernising the CAP.
Beside recurring administrative costs, changes to the current CAP tools can involve substantial adjustment costs for national administrations and beneficiaries (training, information, support for applications, increased error rates) as well as one-off investment costs for adapting current systems (IT systems, updated procedures and forms, new technologies).
The table below presents some considerations to take into account in terms of administrative burden.
|
|
Tool
|
Link with administrative burden
|
|
Planning
|
CAP plans
|
The broader scope of plans is offset by the lower level of details required compared to current rural development programmes and current notification requirements for direct payments. Complexity of the strategy and multiplication of requirements will translate in additional burden.
|
|
|
Coordination at national level
|
Double layer of national and regional strategies for rural development is revealed to be cumbersome as changes at one level needs to be reflected at other.
|
|
Direct payments (EAGF)
|
Decoupled support – targeted in function of farm size and territories and years from setting-up (according to needs), in line with EU objectives
|
Easier to combine different schemes under the new delivery model. Following elements may increase the complexity:
·mandatory capping per farm: simplified methods for taking account of salaried labour and family labour cost can reduce administrative burden,
·no substantial difference in terms of administrative burden if redistribution through a differentiated basic layer or top-ups to a basic layer,
·small farmers: simplified application procedures for small farmers reduce the burden for beneficiaries,
·payment for young/new farmers: reported to be less burdensome for beneficiaries,
·definition genuine farmer will impact the number of beneficiaries and corresponding administrative burden: higher minimum requirements in terms of hectares or share in income will translate in less beneficiaries and corresponding burden reduction – requirements in term of hectares are much simpler to implement but the risk of excluding too many farmers is higher,
·request for transition/convergence period and use of historic references (entitlements) will constitute additional burden.
Administrative burden will also vary significantly in function of the level of detail with regard to national requirements and eligibility conditions.
|
|
|
Optional voluntary coupled support
|
VCS scheme is reported to be burdensome for beneficiaries and administrations (design of the schemes, approval of applications and justification to the Commission) , although this depends to a large extent to Member States' choices. Hence, some limitation (in terms of sectors and time) might be considered to decrease administrative burden.
|
|
|
Conditionality
|
Cross-compliance principles complemented with greening practices allow for better integration with other instruments.
The list of SMRs and GAECs is an exhaustive list serving as baseline for all area and animal-related CAP payments.
For SMRs, national requirements are set on the basis of an EU list as implemented by Member States. For GAECs, requirements apply as defined at national level taking account of local and climatic conditions.
Further requirements may be set if linked to EU objectives to serve as baseline if Member States want to be more ambitious. Additional requirements can be source of complexity and administrative burden depending on Member State´s application.
|
|
|
Optional voluntary eco-schemes
|
Eco-schemes are expected to be more flexible and better tailored than the current greening. They cover practices additional to conditionality, but different from AECM. They can be used as stand-alone or entry-level scheme towards Pillar II interventions, and work as an incentive payment linked to decoupled direct payment, or as a compensation payment calculated on extra costs or loss of income.
Budget linked to eco-schemes is difficult to plan because the scheme is voluntary. There is thus a risk of underspending – it could therefore also be planned under EAFRD. It also requires a clear demarcation with conditionality and AECM to avoid overlaps, including in terms of administrative burden.
|
|
Rural development measures (EAFRD)
|
Area-based environmental payments (Agro-environmental measures (AECM) and forestry)
|
Reduced number of measures and sub-measures as well as simplified requirement should facilitate planning and management of the tool.
Some administrative burden is linked to AECM as it requires information on income foregone and cost incurred for premium calculation.
The multi-annual nature of the measure facilitates budget planning and potential shift of budget towards/from other measures in function of the uptake by beneficiaries.
|
|
|
Areas under natural constraints
|
Current delimitation of ANC is kept.
|
|
|
Project-based measures (investments, financial instruments, business development support, risk management, cooperation, advice)
|
Reduced number of measures and sub-measures as well as simplified requirements should facilitate planning and management of the tool. Delivery model allows better targeting of national and regional needs.
Project-based measures require calls for projects which involve higher administrative burden for national administrations and beneficiaries.
Some additional elements to consider in terms of administrative burden:
·financial instruments will be included in the CAP plan,
·installation grants require a business plan to be drawn up,
·ambition with regard to Agricultural Knowledge and Innovation Systems (AKIS) implies higher administrative burden, but it could be integrated with Farm Advisory Services.
·Possible use of simplified cost options can reduce administrative burden on both national administrations and beneficiaries.
|
|
Applications
|
Eligibility criteria and evidence requested for applications
|
The shift towards performance can be translated into a lower number of eligibility criteria or requirements and/or into less evidence requested at time of application, translating into fewer burdens for beneficiaries for submitting applications and for national administrations to perform administrative checks.
The increased use of single, smart (e.g. linked to other data sources, including from other administrative entities) and pre-filled (e.g. based on previous year information) forms will also reduce the burden for beneficiaries. This may involve some limited additional burden for national administrations to set up systems and perform preliminary checks of pre-filled forms. The wider use of geo-spatial aid applications, possibly combined to sentinels images, can further decrease burden for beneficiaries. Likewise, digitisation e.g. through the development of apps can positively impact time for applications.
|
|
|
Payment claims
|
Member States may choose to further use simplified cost options and so limit the evidence requested.
|
|
Controls
|
Administrative checks
|
In addition to the above possible gains under applications and payment claims, the use of remote sensing and of satellite or sentinels images can facilitate the administrative checks.
|
|
|
On-the-spot controls
|
While compliance by beneficiaries with eligibility rules is no longer subject to conformity audits by the EC and amounts recovered can be kept and reused, the setting by national administrations of own acceptable level of risk can potentially translate in a reduced number of controls.
Increased use of technology, e.g. satellites/sentinels images uploaded in LPIS, for control of performance (instead of compliance) can also reduce the number and extent of on-the-spot controls.
|
|
Monitoring and reporting
|
Indicators and targets
|
The reduced number of mandatory EU indicators for monitoring and reporting is expected to reduce the monitoring and reporting costs. The number of indicators are still dependent on the complexity of the design (variety of tools implemented).
The thorough identification at planning stage of data needs permits to foresee data collection through smart application forms and can limit additional effort from beneficiaries. The automation and increased use of data from existing sources should also positively contribute to reduced costs for monitoring. The use of sentinel images for monitoring can also reduce monitoring costs.
|
|
|
Coordination at national level
|
Aggregation of data at national level can remain an important issue, requiring thorough coordination of the task if performed at regional level. The linkage of reporting to performance clearance and the financial incentive on performance can represent an additional pressure for sound aggregation of data.
|
|
|
Annual performance reports
|
Streamlined single reporting obligations on the whole CAP plan will reduce the administrative burden compared to the multiple reporting channels.
Automatic generation of data can facilitate the reporting but requires possible updates of the systems.
|
4.3.Assessing administrative burden reduction
4.3.1.Methodological approach
According to the Better Regulation rules, the Commission defines administrative costs as the costs incurred by enterprises, the voluntary sector, public authorities and citizens in meeting legal obligations to provide information, either to public authorities or to private parties. The Commission has developed a methodology to assess and quantify administrative costs: the EU Standard Cost Model
. This model is the standard model to be used when assessing administrative costs in the context of new legislation.
The EU Standard Cost Model assesses the administrative costs on the basis of the average cost of the required administrative activity multiplied by the total number of activities performed per year. The average cost per activity is estimated by multiplying a tariff and the time required per action. The quantity is calculated as the frequency of required actions multiplied by the number of entities concerned. The total administrative costs are estimates on the number of full time employment working at national level on the CAP. Considering that the administrative burden and enforcement costs are difficult to differentiate for a comprehensive policy as the CAP, the present assessment does not further detail administrative costs into administrative burden and the business-as-usual. For beneficiaries also, 100% of administrative costs for information obligations under the CAP are considered administrative burden, while the costs for the day-to-day farm management and accountancy is not accounted for in the estimated costs. The 2010 project on measurement of administrative burden for businesses estimates the share of business-as-usual in the administrative costs to be less than 5%.
The options are those considered in the impact assessment. The administrative costs of the baseline (BAS), or option 1, are not differentiated in function of the budget reduction, considering that the linear budget reduction will not impact administrative tasks. Only the impact on administrative costs of changes under the options 3, 4 and 5 are estimated and are presented in terms of estimated percentage reduction in costs for the target group.
The number of entities for national administrations is function of the level at which each action is performed (national or regional) and of the entity performing the task (competent authority, managing authority, coordinating body, paying agency or certification body). At present, and excluding the UK, there are 28 national bodies (with Flanders and Wallonia separated), 114 regional bodies, 6 coordinating bodies, 76 paying agencies and 56 certification bodies. With regard to beneficiaries, there are at present about 7 million farmers receiving payments under at least one of the direct payment schemes (with about 15 million payments), while there are over 4 million claims under rural development measures, of which 300 000 project-based.
Tariffs used are EU hourly wage averages. For national administrations, the tariff for clerks is used for tasks such as administrative and on-the-spot checks (ISCO 4, € 18/hour), while the tariff for legislators is used for planning and reporting (ISCO 1, € 41.61/hour). For beneficiaries, assuming that the person submitting and managing applications and claims for payments, and cooperating for controls, is the person managing the farm, the category of managers is chosen (ISCO 2, € 41.61).
Considering the uncertainties surrounding the decisions of Member States under the CAP strategic plan, a simplified Standard Cost Model approach is taken, by associating reasonable reductions in information obligations under each option in comparison to a baseline built on existing studies. The aim of the assessment is to illustrate potential administrative burden reduction for direct payments and rural development brought by the CAP post-2020 modernisation and simplification. It is assumed that Member States take up in the design and delivery of the CAP a part of the actions needed to reach these reductions, such as favouring simpler schemes, reducing control of compliance, etc.
The following assumptions are taken for national administrations:
|
Assumptions for national administrations
|
|
Planning
|
Simpler and less detailed planning, disappearance of notifications and integration of sectorial programmes. Differences between options determined as follows: lowest variety and complexity in options 3a and 4b, somewhat higher complexity in option 4a, highest complexity in options 3b and 5.
|
|
Applications and payment claims
|
Reduced evidence to be verified under administrative checks and payment claims. Under options 3 and 4, the minimum requirements (minimum hectares under 3a and 3b, minimum share in income under 4a and 4b) reduces the number of eligible beneficiaries. Under option 5, the inclusion of ANC payments under direct payments shifts part of the burden from rural development towards direct payments.
|
|
Audits and controls
|
Less requirements and shift towards control of performance reduces the scope of the controls. The number of controls in reduced in options 3 and 4 proportionally to the reduction in beneficiaries.
Significant reduction in time for audits due to the reduced EU requirements. The time for performance clearance is function of the CAP plan (and report) – differences between options are assimilated to reductions under planning.
|
|
Monitoring and reporting
|
Significant reduction in the number of indicators: differences between options are assimilated to reductions under planning.
Increased costs for ensuring quality of data (incentivised by the performance clearance) and increased coordination for aggregating data.
Streamlined reporting with variations in function of complexity of option.
|
The following assumptions are taken for beneficiaries:
|
Assumptions for beneficiaries
|
|
Applications
|
Fewer requirements (eligibility criteria) translate in reduced evidence to be submitted and reduced quantity of information to be filled in the application form. Variations between options are function of complexity of options.
|
|
Controls
|
Less requirements and shift towards control of performance reduces the scope of the controls. Higher reduction under option 4b (low complexity of option + low environmental requirements).
|
4.3.2.Estimated administrative burden reduction
Given the uncertainty linked to the administrative burden achieved, figures are presented as ranges. The results estimate the annual burden reduction. It should be noted however that a number of actions only occur in the first years of the plan (investments, planning, setting-up and adapting of systems) and that the burden may reduce over time as they become more familiar or because it takes some time to shift to new practices.
Graph 3 and 4 show the overall estimated potential reduction in administrative burden for the categories of information obligations of respectively national administrations and beneficiaries.
Graph 3 Potential for administrative burden reduction for national administrations per cost category
Graph 4 Potential for administrative burden reduction for beneficiaries per cost category
4.3.1.Estimated administrative burden reduction under the impact assessment options
The potential for administrative burden reduction is the highest under option 4b. It combines a low number of payment schemes (basic payment and VCS limited to extensive livestock) and conditionality limited to basic environmental requirements. For national administrations, some additional time gains are also realised by the reduction in beneficiaries with the minimum requirement to be granted the payment at 2% of the average income.
The low complexity in design of option 3a, with a simple flat rate, though supplemented with an eco-scheme with additional environmental requirements, results in a fairly high reduction in administrative costs. Additional reduction in administrative burden for national administrations is reached through the important decrease in eligible beneficiaries with the minimum requirement of 2 hectares.
Option 4a, while similar in design to option 4b, includes a stricter set of environmental requirements, resulting in a more limited potential reduction in administrative costs.
The conservative approach of option 3b implies a high complexity in design, and thus less potential reduction of administrative burden, with the use of entitlements, basic and redistributive payments which are capped per farm and per hectare, and high VCS. Some additional gains result nevertheless from the reduction in beneficiaries, similarly to option 3a.
Option 5 brings the lowest potential reduction in administrative burden, due to the complex (VCS, redistributive payments, top-ups) and prescriptive approach taken by Member States. This option also entails the highest number of eligible beneficiaries, compared to options 3 and 4 where minimum eligibility requirements are set.
Graph 5 shows the overall estimated potential reduction in administrative burden for national administrations.
Graph 5 Potential for administrative burden reduction for national administrations per option
In Graph 6, the estimated potential administrative burden reduction for a single beneficiary is given.
Graph 6 Potential for administrative burden reduction for a single beneficiary per option
The potential reduction translates in the following estimated annual level of administrative burden (including one-off costs).
|
|
Estimated administrative burden under the baseline
|
Estimated administrative burden under the new delivery model
|
|
National administrations
|
EUR 2.98 billion
|
EUR 2.74-2.82 billion
|
|
Beneficiaries
|
EUR 3.84 billion
|
EUR 3.43-3.67 billion
|
5.Towards efficient CAP design and delivery
Any legislation brings its share of administrative burden. This is necessary for accountability reasons: the achievements of a public intervention should be assessed and reported. Administrative burden is even more unavoidable under financial programmes as transactions involving public support will need to be justified. What is important is hence to balance the need for accountability and simplification to reach a proportionate administrative burden (value for money).
This further implies that trade-offs need to be made when designing national strategies. Better tailoring and targeting of payments and higher environmental requirements may generate more administrative burden, but these may be balanced out by greater effectiveness. Likewise, reducing administrative burden through the increased use of ICT requires potentially significant investments.
To assess the proportionality of costs, the share of administrative burden in the total CAP budget is calculated, considering the current budget under the baseline (BAS) and a reduced budget under the other options. This share is confronted with the MCA score for effectiveness of the options, covering the three challenges (economic, environmental, social).
The results are shown in graph 7 below. Options 3a and 5 are the most efficient options, driven by a high effectiveness, while the baseline with budget cut ranks worst (no change in burden, lowest score for effectiveness).
Graph 7 Administrative efficiency of options
Annex 8 - Behavioural evidence from focus groups with European farmers on approaches to encourage more environmental-friendly practices
Joint Research Centre (JRC)
Unit I.2 Foresight, Behavioural Insights and Design for Policy
with a contribution from Unit D.4 Economics of Agriculture
Context and objectives
Behavioural sciences are increasingly informing policy-making
, including agricultural policies
. Their unique contribution to policy lies in the first-hand evidence they provide regarding how people think and behave.
For the reform of the Common Agricultural Policy to be a success, it is necessary to understand farmers' decision-making and viewpoints beyond the assumptions made by neoclassical economics, because farmers' motivations are not only driven by profit maximisation
. The background documents on the economic
and environmental
challenges facing agriculture and rural areas – which accompany the Communication on the Future of Food and Farming – include reviews of the behavioural sciences literature.
In this context, a qualitative study was conducted to better understand farmers' experience with the three CAP instruments designed to motivate them to adopt more environmentally-friendly practices: cross compliance, green direct payments (i.e., "greening") and voluntary agri-environmental and climate measures. A particular focus was farmers' views and understanding of the logic behind these mandatory, conditional and voluntary schemes. Given the qualitative nature of data collection, the objective was to present narratives, discourses and perceptions expressed by farmers who participated in the exercise
.
Methodology
Six focus groups were carried out in January 2018 in Seville (Spain), Tours (France), and Lublin (Poland). These locations were selected due to the diversity of farming activities, crops and cultural contexts. Each focus group was attended by 6 to 8 farmers who were recruited over the phone. During recruitment, a screening questionnaire was administrated to ensure that participants were all subject to at least one obligation of greening and to allow some variety in participants' types of crops, membership in a cooperative, farm size, and age. As with any focus group, the objective was not to constitute a sample representative of the whole population of farmers in the EU, but rather to get a diverse mix of participants
.
In each location, two focus groups were conducted, each one being rather homogeneous with regard to the adoption of environmentally-friendly practices
in order to encourage participation:
-one focus group with farmers relatively highly committed toward the environment (i.e. 'green' farmers)
-one focus group with farmers with a low to average environmental commitment (i.e. 'conventional' farmers)
A semi-structured discussion guide was designed to cover progressively various topics in a funnelling approach: identification of environmentally-(un)friendly practices, motivations and barriers to the adoption of more environmentally-friendly practices, current environment-related incentive schemes, recommendation for future incentive schemes. The present document only presents the results from the sections on incentives. Examples of 'verbatims' are provided throughout the document in footnotes.
Results
General discussion on incentives
When asked to spontaneously mention both positive and negative incentives that can motivate farmers to adopt more environmentally-friendly practices, participants first and foremost referred to legal and economic tools. The discourse of 'conventional' farmers revolved mainly around obligations, economic sanctions, economic incentives, and mandatory schemes
. In contrast, 'green' farmers (especially in Seville and in Tours) tended to more spontaneously discussed voluntary schemes, not only from the CAP
. The higher market price for crops grown in a more environmentally-friendly way was also an economic incentive for some
, but only provided consumers are sufficiently conscious about these issues
.
Besides economic tools, participants also mentioned trainings
(e.g. to understand the appropriate time for spraying pesticides, to become more conscious of the environmental impacts of certain farming practices) and advice from consultants (with some doubts as to their impartiality) as other incentives to motivate them to adopt more environmentally-friendly practices. Collective incentives never spontaneously emerged.
Prior to specifically tackling CAP related tools, participants freely discussed the overall logic of mandatory, conditional and voluntary schemes. Mandatory schemes leveraging sanctions to enforce certain regulations on environmentally-friendly practices were deemed relevant to prevent farmers from causing severe damages to the environment
. However, generally speaking, participants considered the philosophy of voluntary schemes, based on reward, as a more appropriate tool given its encouraging and constructive approach, compatible with farmers' value of freedom
. Participants often used the 'stick and carrot' analogy to refer to the different types of schemes and the concept of 'conditional' schemes did not often come out spontaneously.
Key insights
·'Green' farmers seem to think more spontaneously of voluntary schemes when reflecting on incentives, compared to 'conventional' farmers whose discourse revolves more around mandatory schemes.
·Voluntary schemes are more encouraging and compatible with freedom values.
·Mandatory schemes and sanctions are relevant and important drivers for conventional farmers.
Cross compliance
The principle of minimum requirements imposed by the Good Agricultural and Environmental Conditions was generally well perceived by participants. The metaphor that was often mentioned was that of Highway Code
: just as it is forbidden to drive too fast on roads, it's forbidden, for instance, to spray pesticides very close to rivers. And just as people are not rewarded for driving at the right speed, farmers do not get specific money to meet these requirements
. Participants justified the existence of cross compliance by the need to ensure that every farmer complies with the regulation
and that serious infringements are penalised
.
The uneven implementation of cross compliance regulations across the EU was a recurrent topic of discussion among French farmers, this problem being due, according to them, to each country protecting their farmers' interests and to the unequal controls between different countries
. In Poland, participants spontaneously expressed the fear of denunciation by neighbouring farmers as a driving force for compliance
.
Key insights
·Cross compliance is generally well accepted by participating farmers.
·Perceived uneven implementation and controls across the EU causes concern for lack of level-playing field
Greening
Participants were all well aware of the greening requirements including the recent changes to some specifications – probably because they were recruited based on the fact that they had to comply with at least one obligation of greening. In contrast, within each group there was no clear consensus regarding the voluntary, conditional or mandatory nature of the practices included in greening
: although participants did understand the possibility to voluntarily opt-out, some described the scheme as mandatory because they needed this payment. Participants indeed comply with the greening requirements, mainly because they fear losing part of their basic payments
. Likewise, the complement/bonus or a due/right
nature of greening was a disputed concept and the concept of 'conditionality' was virtually not used in participants' own words to describe greening.
Greening tends to be viewed positively as it provides some tangible benefits, mainly for wildlife (ecological focus areas)
, for soils (crop diversification and catch crops mean less need of chemicals)
and ultimately for business
, without too much constraints
. The three main points of concern spontaneously discussed were the lack of coherence of some requirements with the stated environmental goals
, scepticism regarding the true goal of greening
and the lack of additivity
. There is a perception, also, that greening demands could increase in the future
.
Key insights
·Greening is part of participating farmers' understanding of the Common Agricultural Policy.
·The voluntary, conditional or mandatory nature of greening is debated.
·Participating farmers view greening overall as positive even though they express some concerns.
Agri-environmental and climate measures
Overall, participants viewed agri-environmental and climate measures as a voluntary scheme
and they were aware of their existence, except most Polish participants in the 'conventional' group
. The motivations to participate in these voluntary schemes are mainly economic
: there is indeed a feeling that these schemes provide a much-needed financial extra necessary for the economic survival of some farmers. The administrative constraints as well as the controls are seen as stringent
and therefore putt off many participants
.
In focus groups in France and Poland, participants expressed some scepticism regarding agri-environmental and climate measures: French participants saw them as too selective in their criteria
and sometimes not additive
, and mentioned that these voluntary schemes are mainly signed by smaller farmers due to their high need for additional income
. Among the main points of concern, Polish participants repeatedly mentioned information asymmetry (i.e. there is a perception that some farmers have access to privileged, early information on some calls for voluntary schemes)
, difficulty in applying
and biased granting of the schemes
. Virtually all groups digressed on the issue of changing rules during the completion of the voluntary scheme
.
Key insights
·The existence and nature of agri-environmental and climate measures is well understood, with the notable exception of Polish participants in the conventional group.
·Environmental motives generally play little role in sign-up.
·Participants in Poland view agri-environmental and climate measures as difficult to obtain because of information asymmetry and biased granting.
Recommendations for future incentive schemes
Throughout the focus groups, farmers' narratives abundantly revolved around how incentive schemes should be designed. The following box summarises the main recommendations.
Key insights
·Incentive schemes should still come from the EU
.
·A better knowledge of farming in general and rural, local conditions in particular is needed to design coherent and meaningful incentives
.
·Better educating consumers about the value of environmentally-friendly products
would allow farmers to sell their products at a better price.
·Targeting incentive schemes to 'real' farmers
and, more specifically, to small farmers
.
·More level-playing field between farmers as to voluntary schemes, between EU Member States and between the EU and the rest of the world as to environmental constraints and controls
.
Annex 9 – Bibliography
AD et al. (2009)
Evaluation of the Implementation of the Farm Advisory System
, Study to the European Commission.
Agricultural Markets Task Force (2016)
Improving market outcomes, enhancing the position of farmers in the supply chain
, Final report for the European Commission.
Agrosynergie (2015)
Evaluation of Article 68 measures
, Study to the European Commission.
Agrosynergie GEIE (forthcoming)
Impact of the CAP measures towards the general objective "viable food production"
, Study to the European Commission.
Alliance Environment (2007)
Evaluation of the application of cross compliance as foreseen under regulation 1782/2003
, Study to the European Commission.
Alliance Environment et al. (2017)
Evaluation study of the payment for agricultural practices beneficial for the climate and the environment
, Study to the European Commission. Report of the evaluator.
Alterra Wageningen UR et al. (2011)
Impacts of renewable energy on European farmers. Creating benefits for farmers and society
, Study to the European Commission.
Arete (2013) –
Study on assessing the added value of PDO/PGI products
, Study to the European Commission.
Arroyo De Sande, C el al. (2018) Provision of social care and support services in remote rural areas: Challenges and opportunities, European association of service providers for persons with disabilities.
Augère-Granier, M.-L. (2016)
Short Food Supply Chains and Local Food Systems of the EU
, European Parliamentary Research Service.
Augère-Granier, M-L. (2017)
Rural poverty in the European Union
, European Parliamentary Research Service.
Baldock, D. et al. (2018)
Measuring the CAP’s environmental and climate performance
, Institute of European Environmental Policy.
Bardaji, I. et al. (2016)
State of play of risk management: Tools implemented by member States during the period 2014- 2020: national and European frameworks
, Study to the European Parliament Committee on Agriculture and Rural Development.
Beedell et al. (1999)
Explaining Farmers’ Conservation Behaviour: Why Do Farmers Behave the Way They Do?
Journal of Environmental Management,
Volume 57, Issue 3
.
Bertolini, P. et al. (2008)
Poverty and social exclusion in rural areas
, Study to the European Commission.
Bijman J. et al. (2012)
Support for Farmers Cooperatives
, Study to the European Commission.
Blomquist J. et al. (2014)
Do the CAP Subsidies Increase Employment in Sweden? Estimating the Open Economy Relative Multiplier Using an Exogenous Change in the CAP
, EAAE 2014 Congress ‘Agri-Food and Rural Innovations for Healthier Societies’, Ljubljana, Slovenia.
Bock B. et al. (2015)
Changing social characteristics, patterns of inequality and exclusion.
In Territorial cohesion in rural Europe. Editions K.Kopus A., De Lima F.
Bonnet, F. (2016)
Aménager les territoires ruraux et périurbains
, Ministre du Logement, de l’Egalité des territoires et de la Ruralité, France.
Borrelli P. et al. (2017)
A new assessment of soil loss due to wind erosion in European agricultural soils using a quantitative spatially distributed modelling approach
, Land Degradation & Development, Volume 28, Issue 1.
Boulanger, P. et al. (2016)
Cumulative economic impact of future trade agreements on EU agriculture, European Commission
, Joint Research Centre (JRC).
Boulineau, E. et al. (2014) La pauvreté en Europe. Une approche géographique, Editions PUR, Géographie sociale.
Breustedt G. et al. (2013)
Calibrating agri-environmental schemes using a two-stage discrete choice experiments - Discrete-Choice-Experiments
German Journal of Agricultural Economics, Volume 62, Issue 4.
Brown D. et al. (2010)
Rethinking the OECD’s New Rural Demography
, Centre for Rural Economy, University of Newcastle Upon Tyne.
Brunori, G. et al. (2000)
Synergie and Coherence through Collective Action: some insights from wine routes in Tuscany
, Sociologia Ruralis, Volume 40, Issue 4.
Bureau, J.C. (2017)
Does the WTO discipline really constrain the design of CAP payments?
, website.
Business Wire (2015)
Research and Markets: France Crop Protection Pesticides Market - Growth, Trends and Forecasts (2015-2020)
.
Cannarella C. et al (2007)
Barriers to Innovation in Rural Enterprises: the Strategy of “Doing Nothing”,
New Medit n°4.
Capgemini et al. (2010)
EU Project on Baseline Measurement and Reduction of Administrative Costs
, Study to the European Commission.
Capgemini et al. (2011)
Study on administrative burden reduction associated with the implementation of certain Rural Development measures
, Study to the European Commission.
CEMA,
European Agricultural Machinery Association
, website.
Ciaian, P. et al. (2016).
The Impact of the 2013 CAP Reform on the Decoupled Payments' Capitalization into Land Values in the EU
, European Commission, Joint Research Centre (JRC).
Coffey et al. (2016)
Evaluation study on the implementation of the new European Innovation Partnerships (EIP) for Agricultural Productivity and Sustainability
, Study to the European Commission.
Cogeca (2015) "
Development of agricultural cooperatives in the EU, 2014
" PUB (14) 9112:2, Brussels.
Copenhagen Economics (2016)
Impacts of EU trade agreements on the agricultural sector
, Study to the European Commission.
Cordier, J. (2014)
Comparative analysis of risk management tools supported by the 2014 farm bill and the CAP 2014-2020
, Study to the European Parliament
Council of the European Union (2018)
Communication on "The Future of Food and Farming"
– Presidency conclusions, 7324/18
Courteny P. et al. (2011)
European Development Opportunities for Rural Areas, (EDORA)
, Study to the European Commission
Crescenzi R. et al. (2014)
The EU Cohesion policy in context: regional growth and the influence of agricultural and rural development policies
, Department of Geography and Environment, London School of Economics and Political Science, LEQS Paper N° 85.
Crescenzi R. et al. (2016)
The EU Cohesion policy in context: Does a bottom-up approach work in all regions?
Department of Geography and Environment, Environment and Planning A, Volume 48, Issue 11.
Dauvin, M et al. (2014)
Estimating broadband diffusion in the EU using NUTS1 regional data
, Economic Research Southern Africa (ERSA).
Davidova S. et al. (2013)
Semi-subsistence farming: value and directions of development
, Study to the European Parliament.
Dax, T et al. (2016)
The future of Rural Development
, Workshop on "‘Reflections on the agricultural challenges post-2020 in the EU: preparing the next CAP".
Defrancesco, E. et al. (2008)
Factors affecting farmers’ participation in agri-environmental measures: a northern Italian perspective
, Agricultural Economics, Volume 59, Issue 1.
Deloitte (2012)
eGovernance study at EU / Member State level
, Study to the European Commission.
Dudu, H. et al. (2017)
Impact of CAP Pillar II Payments on Agricultural Productivity
, European Commission, Joint Research Centre (JRC).
Ecorys (2010)
Study on employment, growth and innovation in rural areas
, Study to the European Commission.
Ecorys (2014)
"Gold-plating" in EAFRD, To what extent do national rules unnecessarily add to complexity and, as a result, increase the risk of errors
, Study to the European Parliament.
Ecorys (2015)
Pilot project: Exchange programmes for young farmers
, Study to the European Commission.
Ecorys (2017)
Modernising and simplifying the CAP. Summary of the results of the public consultation
, Study to the European Commission.
Ecorys (Forthcoming) Synthesis of Rural Development Programmes (RDP) ex-post evaluations of period 2007-2013.
Ecorys et al. (2010)
Study on employment, growth and innovation in rural areas (SEGIRA),
Study to the European Commission.
Ecorys et al. (2016)
Mapping and analysis of the implementation of the CAP
, Study to the European Commission.
Ecorys et al. (Forthcoming) Study on risk management in EU Agriculture. Study to the European Commission.
EIP AGRI Focus Group (2015)
Precision Farming
, Study to the European Commission.
EIP-AGRI (2017)
Horizon 2020. Multi-actor projects
, Study to the European Commission.
EIP-AGRI (2017)
List of multi-actor projects
, Agriculture and Innovation, website.
EIP-AGRI (2017)
Shaping the digital (r)evolution in agriculture
Study to the European Commission.
EIP-AGRI (2017)
Skills development: education & training, advice, peer to peer exchange and networking
Agri Innovation Summit (AIS) "Innovation – shaping the future", 12 October.
EIP-AGRI (2018)
Brochure Agricultural Knowledge and Innovation Systems
, Study to the European Commission.
EIP-AGRI, Focus Group (2015)
Innovative Short Food Supply Chain management
, Report to the European Commission.
EIP-AGRI, Workshop (2017)
Cities and Food: connecting consumers and producers
, Report to the European Commission.
Eurofound (2014),
Quality of life in urban and rural Europe
, Publications Office of the European Union, Luxembourg.
EUROISLANDS (2011) –
The development of the Islands
- European Islands and Cohesion Policy,
Annex IV- Analysis if the relevant literature
, ESPON programme.
European Commission (2008)
Green Paper on Territorial Cohesion. Turning territorial diversity into strength
, Communication from the Commission to the Council, the European Parliament, the Committee of the Regions and the European Economic and Social Committee, COM 616 final.
European Commission (2012)
Innovating for Sustainable Growth: A Bioeconomy for Europe
Communication from the Commission to the European Parliament, the Council, the European Economic and Social Committee and the Committee of the Regions, COM 60 final
European Commission (2012)
The Implementation of the Water Framework Directive (2000/60/EC) River Basin Management Plans
, Report from the Commission to the European Parliament and the Council, COM 670 final.
European Commission (2013)
Impact Assessment
, Communication from the Commission to the Council, the European Parliament, the European Economic and Social Committee and he Committee of the Regions a Clean Air Programme for Europe, Proposal for a Directive of the European Parliament and of the Council on the limitation of emissions of certain pollutants into the air from medium combustion plants, Proposal for a Directive of the European Parliament and of the Council on the reduction of national emissions of certain atmospheric pollutants and amending Directive 2003/35/EC, Proposal for a Council Decision on the acceptance of the Amendment to the 1999 Protocol to the 1979 Convention on Long-Range Transboundary Air Pollution to Abate Acidification, Eutrophication and Ground-level Ozone, Staff Working Document 531 final.
European Commission (2014) Commission Implementing Regulation (EU) No 834/2014 of 22 July 2014 laying down rules for the
application of the common monitoring and evaluation framework of the common agricultural policy.
European Commission (2014, 2016)
EU Market observatories
, website.
European Commission (2015)
Better Regulation for Better Results — An EU Agenda
, Communication from the Commission to the European Parliament, the Council, the European Economic and Social Committee and the Committee of the Regions, COM 215 final.
European Commission (2015)
Better Regulation Toolbox
.
European Commission (2015)
Digital Agenda Scoreboard: Most targets reached, time has come to lift digital borders
, website.
European Commission (2015)
Ecological flows in the implementation of the Water Framework Directive
, CIS guidance document nº31, Technical Report 086
European Commission (2015)
Glossary of the Common Agricultural Policy
, website.
European Commission (2015)
The mid-term review of the EU biodiversity strategy to 2020
, Report from the Commission to the European Parliament and the Council, 478 final.
European Commission (2016)
Annual Activity Report
and
annexes
, Directorate General for Agriculture and Rural Development.
European Commission (2016)
CAP context indicators
, Directorate General for Agriculture and Rural Development.
European Commission (2016)
Cork 2.0: European Conference on Rural Development
, website.
European Commission (2016)
Development of the dairy market situation and the operation of the "Milk Package" provisions
, Report from the Commission to the European Parliament and the Council, COM 724 final.
European Commission (2016)
European Research and Innovation for Food and Nutrition Security
Staff Working Document 319 final
European Commission (2016)
Final paper on a strategic approach to EU agricultural research and innovation
, Horizon 2020.
European Commission (2016)
Fitness check of the EU nature legislation (birds and habitats directives)
, Staff working document 472.
European Commission (2016)
Monitoring EU Agri-Food Trade: Development until December 2016
, Directorate General for Agriculture and Rural Development, website.
European Commission (2016)
Next steps for a sustainable European future: European Action for sustainability
Communication from the Commission to the European Parliament, the Council, the European Economic and Social Committee and the Committee of the Regions, 739 final.
European Commission (2016)
Productivity in EU agriculture – slowly but steadily growing
, Directorate General for Agriculture and Rural Development, EU Agricultural Market Brief n°10.
European Commission (2016)
Prospect for the EU agricultural markets and income 2016-2026
, Directorate General for Agriculture and Rural Development, EU Agricultural Outlook Report.
European Commission (2016)
REFIT Platform Opinion on the submission by the European Environmental Bureau on Effectiveness and Efficiency of the Common Agricultural Policy
, Refit Platform Opinion.
European Commission (2016)
REFIT Platform Opinion on the submission by the Freistaat Saachsen on the overlaps between Pillar I and II of the Common Agricultural Policy
, Refit Platform Opinion, Stakeholder Suggestions.
European Commission (2016)
REFIT Platform Recommendations and other work: Agriculture and Rural Development
, website.
European Commission (2016)
Review of the Greening after one year
, Staff Working Document, 218 final.
European Commission (2016)
The implementation of the scheme of specific measures for agriculture in favour of the outermost regions of the Union (POSEI)
Report from the Commission to the European Parliament and the Council, COM 797 final.
European Commission (2017) "
Reflection Paper on the future of EU Finances
" COM 358.
European Commission (2017)
A stronger and renewed strategic partnership with the EU's outermost regions
Communication from the Commission to the European Parliament, the Council, the European Economic and Social Committee and the Committee of the Regions, COM 623 final.
European Commission (2017)
Agriculture and Sustainable Water Management in the EU
, Staff working document 153.
European Commission (2017)
Background documents on challenges facing EU agriculture and rural areas: economic, social, environmental and climate
, Directorate General for agriculture and rural development.
European Commission (2017)
Consultation on modernising and simplifying the common agricultural policy (CAP)
, Directorate General for Agriculture and Rural Development, website.
European Commission (2017)
EU Agricultural outlook for the agricultural markets and income 2017-2030
, Directorate General of Agriculture and Rural Development, Joint Research Centre (JRC).
European Commission (2017)
Eurobarometers on the Common Agricultural Policy
, website.
European Commission (2017)
Europe's Digital Progress Report
, Staff Working Document 160 final.
European Commission (2017)
Evaluation and studies plan
2017-2021, Directorate General for Agriculture and Rural Development.
European Commission (2017)
Evaluation of the impact of the CAP measures towards the general objective of “viable food production
”, Indicative roadmap.
European Commission (2017)
Fuelling the potential of advisors for innovation
, Directorate General of Research and Innovation, H2020 project Call RUR-16-2019.
European Commission (2017)
High Level Group monitoring simplification for beneficiaries of ESI Funds
, Regional Policy.
European Commission (2017)
Horizon 2020 interim evaluation on societal challenges Societal challenge 2: Food Security, Sustainable Agriculture and Forestry, Marine, Maritime and Inland Water Research and the Bioeconomy
, Directorate General for Research and Innovation.
European Commission (2017)
Implementation of the ecological focus area obligation under the green direct payment scheme
, Report from the Commission to the European Parliament and the Council, 0152 final of 29 March.
European Commission (2017)
Inequality and poverty – what action is being taken by Member States?
, Directorate General for Employment, Social Affairs and Inclusion, website.
European Commission (2017)
Managing risk in the dairy sector: how futures markets could help
, Directorate General for Agriculture and Rural Development, EU Agricultural Market Brief n°11.
European Commission (2017)
Modernising and Simplifying the CAP, Economic challenges facing EU agriculture
, Directorate General for Agriculture and Rural Development.
European Commission (2017)
REFIT Platform Opinion on the submission by the Swedish Industry and Commerce for Better Regulation (NNR) on 'Greening'
, Refit Platform Opinion.
European Commission (2017)
Reflection Paper on the future of EU Finances
, COM 358 final.
European Commission (2017)
Report from the Commission to the European Parliament and the Council on the implementation of the ecological focus area obligation under the direct payment scheme,
Staff Working Document 121 final.
European Commission (2017)
Risk management schemes in EU agriculture: Dealing with risk and volatility
, Directorate General for Agricultural and Rural Development., EU Agricultural Market Brief n°12.
European Commission (2017)
The Digital Economy and Society Index
, website.
European Commission (2017)
The Future Of Food And Farming
, Communication from the Commission to the European Parliament, the Council, the European Economic and Social Committee and the Committee of the Regions, COM 713 final.
European Commission (2017)
Workshops for Impact Assessment
, Directorate General for Agriculture and Rural Development, website.
European Commission (2017)
Young farmers in the EU
, Directorate General of Agricultural and Rural Development., EU Agricultural and Farm Economics Briefs n°15.
European Commission (2017),
Agriculture and Sustainable Water Management in the EU
, Staff Working Document 153 final.
European Commission (2018)
A new, modern Multiannual Financial Framework for a European Union that delivers efficiently on its priorities post-2020
, Communication from the Commission to the European Parliament, the European Council and the Council, COM 98 final, 14 February.
European Commission (2018)
Cooperatives
, Directorate General for Internal Market, Industry, Entrepreneurship and SMEs, website.
European Commission (2018)
Review of the EU Air policy
, website.
European Commission,
Future of the CAP
Directorate General for Agriculture and Rural Development, website.
European Commission,
Investment Plan for Europe: The Juncker Plan
, website.
European Commission,
Water Scarcity & Droughts in the European Union
, Previously completed studies 2007-2010, Directorate General for Environment, website
European Council (1992) Directive 92/43/EEC of 21 May 1992
on the conservation of natural habitats and of wild fauna and flora
.
European Court of Auditors (2013)
Have the Member States and the Commission achieved value for money with the measures for diversifying the rural economy?
, Special Report N°6.
European Court of Auditors (2014)
Integration of EU water policy objectives with the CAP: a partial success
, Special Report N°04.
European Court of Auditors (2015)
EU support for rural infrastructure: potential to achieve significantly greater value for money
, Special Report N°25.
European Court of Auditors (2015)
The cost-effectiveness of EU Rural Development support for non-productive investments in agriculture
, Special report N°20
European Court of Auditors (2015)
The EU priority of promoting a knowledge-based rural economy has been affected by poor management of knowledge-transfer and advisory measures
, Special Report N°12.
European Court of Auditors (2016)
Is the Commission's system for performance measurement in relation to farmers' income well designed and based on sound data?
, Special report N°1.
European Court of Auditors (2016)
Making cross compliance more effective and achieving simplification remains challenging
, Special report No 26.
European Court of Auditors (2017)
Greening – a more complex income support scheme, not yet environmentally effective
, Special Report No 21.
European Court of Auditors (2017)
More efforts needed to implement the Natura 2000 network to its full potential
, Special Report N°1.
European Court of Auditors (2017)
Rural Development Programming: less complexity and more focus on results needed
, Special report N°16.
European Court of Auditors (2017)
The certification bodies’ new role on CAP expenditure: a positive step towards a single audit model but with significant weaknesses to be addressed
Special report N°7.
European Court of Auditors (2017).
EU support to young farmers should be better targeted to foster effective generational renewal
, Special Report n°10.
European Environment Agency (2015)
Agriculture and climate change
, Signals - Towards clean and smart mobility, Copenhagen.
European Environment Agency (2015)
State of nature in the EU
, Technical report n°2, Copenhagen.
European Environment Agency (2016)
Annual European Union greenhouse gas inventory 1990–2014 and inventory report 2016,
Submission to the UNFCCC Secretariat. Technical report n°15, Copenhagen.
European Environment Agency (2017)
Climate change, impacts and vulnerability in Europe 2016
, Report n°1, Copenhagen.
European Environment Agency (2017)
Use of freshwater resources
Indicator Assessment, Data and maps, website.
European Feed Manufacturers Federation (2016)
Feed & Food Statistical Yearbook
, website.
European Institute for Gender Equality (EIGE) (2016)
Gender in agriculture and rural development
, Luxembourg.
European Network for Rural Development (2010)
Public goods and public intervention in Agriculture, TWG2: Links between agriculture and the wider rural economy
, website.
European Network for Rural Development (ENRD) (2009)
TWG2 Linkages between agriculture and the wider rural economy
, website.
European Network for Rural Development (ENRD) (2010)
'Remote Care Services' in the Outermost Regions of Portugal
, RDP Project Database, website.
European Network for Rural Development (ENRD) (2017)
Workshop on Social Hubs in Rural Europe
, website.
European Parliament and Council Directive 2000/60/EC of 23 October 2000
establishing a framework for Community action in the field of water policy
.
European Parliament and Council Directive 2001/42/EC of 27 June 2001
on the assessment of the effects of certain plans and programmes on the environment
.
European Parliament and Council Directive 2009/128/EC of 21 October 2009
establishing a framework for Community action to achieve the sustainable use of pesticides
.
European Parliament and Council Directive 2009/147/EC of 30 November 2009
on the conservation of wild birds
.
European Parliament and Council Directive 2011/92/EU of 13 December 2011
on the assessment of the effects of certain public and private projects on the environment
.
European Parliament and Council Regulation (EU) No 1305/2013 of 17 December 2013 on
support for rural development by the European Agricultural Fund for Rural Development (EAFRD)
and repealing Council Regulation (EC) No 1698/2005.
European Parliament and Council Regulation (EU) No 1306/2013 of 17 December 2013
on the financing, management and monitoring of the common agricultural policy
and repealing Council Regulations (EEC) No 352/78, (EC) No 165/94, (EC) No 2799/98, (EC) No 814/2000, (EC) No 1290/2005 and (EC) No 485/2008.
European Parliament and Council Regulation (EU) No 1307/2013 of the of 17 December 2013 establishing
rules for direct payments to farmers under support schemes within the framework of the common agricultural policy
and repealing Council Regulation (EC) No 637/2008 and Council Regulation (EC) No 73/2009.
European Parliament and Council Regulation (EU) No 1308/2013 of 17 December 2013 establishing
a common organisation of the markets in agricultural products
and repealing Council Regulations (EEC) No 922/72, (EEC) No 234/79, (EC) No 1037/2001 and (EC) No 1234/2007.
European Parliament,
A Welcoming Europe?
, website.
Eurostat (2009)
Consumers in Europe
, Eurostat, Statistical book, Luxembourg.
Eurostat (2016)
Data on digital divide
, Eurostat, Statistics on rural areas in the EU, website.
Eurostat (2017)
Sustainable development in the European Union – Monitoring report on progress towards the SDGs in an EU context
, Publication Office of the European Commission.
Eurostat
Agri-environmental indicators
, website.
Eurostat
Food price monitoring tool
, website.
Eurostat
Population by educational attainment by degree of urbanisation
, website.
Eurostat series
Employment by NUTS 3 regions
, website.
Eurostat series
Gross value added
, website.
Eurostat series
Population density
website.
EY et al (2014)
The economic impact of modern retail on choice and innovation in the EU food sector
, Study to the European Commission
Farrell, G, et al. (2000)
Lutter contre l'exclusion sociale en milieu rural
, Innovation en milieu rural, Observatoire européen LEADER, Cahier de l’innovation n°8.
Federal Institute for Research on Building, Urban Affairs and Spatial Development (BBSR) et al. (2014)
ESPON ATLAS Mapping European territorial structures and dynamics
, ESPON programme.
Ferrari E. et al. (2017)
Scene-setter on jobs and growth in EU agri-food sector
, Workshop organised by Directorate General of Agricultural and Rural Development.
Fertilizers Europe (2015)
Industry facts and figures
, website.
Food Drink Europe et al. (2014)
Joining forces for an EU Industrial Policy for the food and drink sector. A European Social Partnership Initiative
.
Forzieri et al. (2016)
Multi-hazard assessment in Europe under climate change
, Climatic Change, Volume 137, Issue 1–2.
Gall, R. et al. (2006)
Agricultural producer cooperatives as strategic alliances
, International Food and Agribusiness Management Review, Volume 9, Issue 4.
Gosling & Williams (2010)
Connectedness to nature, place attachment and conservation behaviour: Testing connectedness theory among farmers
, Journal of Environmental Psychology, Volume 30, Issue 3.
Greenville Jared (2017)
Links between global agriculture and food value chains and jobs and growth
, Workshop organised by Directorate General of Agricultural and Rural Development.
Hélaine S, et al. (2016)
A stochastic approach of the assessment of EU intervention mechanisms for dairy products
, Scientific Congress SFER, VetAgroSup, Clermont, France, 9/10 juin.
Hunt, J. (2014)
Making the CAP Fit: Responding to the Exploitation of Migrant Agricultural Workers in the EU
, The International Journal of Comparative Labour Law and Industrial Relations 30, n° 2
Institute for Environmental European Policy (IEEP) (2011)
Addressing biodiversity and habitat preservation through measures applied under the Common Agricultural Policy
, Study to the European Commission.
Institute for Environmental European Policy (IEEP) et al. (2017)
Service contract to support follow-up actions to the mid-term review of the EU biodiversity strategy to 2020 in relation to target 3A – Agriculture
, Study to the European Commission.
Intergovernmental Panel on Climate Change (2014)
Summary for Policymakers.
In: Climate Change 2014: Impacts, Adaptation, and Vulnerability. Part A: Global and Sectoral Aspects. Contribution of Working Group II to the Fifth Assessment Report, Cambridge University Press, Cambridge, UK and New York, USA.
IRS et al. (2015), "
Ex post evaluation of 2007-2013, Culture and Tourism Final Report
", Work Package 9, Final report to Directorate General for Regional and Urban Policy.
Kallas et al. (2010)
Farmers' objectives as determinants of organic farming adoption: The case of Catalonian vineyard production
, Agricultural Economics, Volume 41, Issue 5.
Kantor (2015)
Synthesis of ex ante evaluations of rural development programmes 2014 - 2020
, Study to the European Commission.
Katsarova, I. (2013)
The (low) absorption of EU Structural Funds
Library of the European Parliament, Library Briefing.
Kovats, R.S. et al. (2014)
Europe
. In: Climate Change 2014: Impacts, Adaptation, and Vulnerability. Part B: Regional Aspects. Contribution of Working Group II to the Fifth Assessment Report of the Intergovernmental Panel on Climate Change, Cambridge University Press, Cambridge, UK and NY, USA.
Kritikos, M (2017)
Precision agriculture in Europe: Legal, social and ethical considerations
, Study to the European Parliament.
LEI (2011)
Evaluation of CAP measures applied to the dairy sector
, Study to the European Commission.
LEI- WUR et al. (2016)
Farm Level Indicators for New Topics in policy evaluation project (FLINT)
, projsct financed under the FP7, website.
Lewis D. et al. (2010)
Refinement of the OECD regional typology: Economic Performance of Remote Rural Regions
Linnemann, L. (2016)
Establishment of a sustainable and environmentally friendly wheat-value chain (OG ENU-Wheat)
, EIP-AGRI workshop ‘Operational Groups: First experiences'.
LMC (2012)
Evaluation of measures applied under the CAP to the cereals sector
, Study to the European Commission
Lugato et al. (2014, 2016) Model framework architecture, validation and scenario analysis.
Mahé L-P. et al. (2016)
The future of market measures and risk management schemes
, Part 2, Study to the European Parliament.
Martinez Juan, A. (2017)
EU rural development policy and the integration of migrants
, briefing (Feb.) European Parliamentary Research Service.
Matthews A. (2017)
Why further reform of the CAP is necessary?
in CAP: thinking out of the box Further modernisation of the CAP – why, what and how?' RISE Foundation
Matthews, A. (2016)
The future of direct payments
, CAP reform post 2020 - Challenges in agriculture, Part 1, Study to the European Parliament.
Maybery, D. et al. (2005) Categorising farming values as economic, conservation and lifestyle, Journal of Economic Psychology, Volume 26, Isssue 1.
M'barek R. et al. (2017)
Scenar 2030 - Pathways for the European agriculture and food sector beyond 2020
, European Commission, Joint Research Centre (JRC).
Metis GmbH et al. (2010)
“Ex-post evaluation of LEADER +
” Study to the European Commission.
Minarelli, F. et al. (2015)
Innovation in European food SMEs: determinants and links between types
, Bio-based and Applied Economics Volume 4, Issue 1.
Minviel, J. et al. (2014). Meta-regression analysis of the impact of agricultural subsidies on farm technical efficiency, EAAE 2014 Congress ‘Agri-Food and Rural Innovations for Healthier Societies’, Volume 26.
Mylona, K. et al (2016)
Delivering on EU food safety and Nutrition in 2050 – future challenges and policy preparedness, European Commission
, Joint Research Centre (JRC).
Mzoughi (2011)
Farmers adoption of integrated crop protection and organic farming: Do moral and social concerns matter?
, Ecological Economics, Volume 70, issue 8.
Nicholls, R.J et al. (2007)
Coastal systems and low-lying areas
. Climate Change 2007: Impacts, Adaptation and Vulnerability. Contribution of Working Group II to the Fourth Assessment Report of the Intergovernmental Panel on Climate Change, M.L. Parry et al. Cambridge University Press, UK.
Nordregio (2006)
Study on Employment in rural areas (SERA)
Final Report to the Direction-General for Agriculture and Rural Development, Brussels.
Nowicki, P. et al. (2006)
Scenar 2020. Scenario study on agriculture and the rural world
, Study to the European Commission
Nurzyńska, I. (2016) The Role of the Common Agricultural Policy in Stimulating Rural Jobs in Poland, 160th EAAE Seminar ‘Rural Jobs and the CAP‘, Warsaw, Poland.
OCDE (2012),
Linking Renewable Energy to Rural Development
, OECD Publishing, Paris.
OECD (2010)
Strategies to Improve Rural Service Delivery
, OECD Publishing, Paris.
OECD (2012)
Promoting growth in all regions. Lessons from across the OECD
, OECD Publishing, Paris.
OECD (2013)
Rural-Urban Partnerships: An Integrated Approach to Economic Development
, OECD Publishing, Paris.
OECD (2017)
Evaluation of Agricultural Policy Reforms in the European Union: The Common Agricultural Policy 2014-20
, OECD Publishing, Paris.
OECD (2017),
Agricultural Policy Monitoring and Evaluation 2017
, OECD Publishing, Paris.
ÖIR et al. (2012)
Synthesis of Mid-Term Evaluations of Rural Development Programmes 2007-2013
, Final Report for the European Commission.
ÖIR et al. (2016)
The role of the EU's Common Agricultural Policy in creating rural jobs
, Study to the European Parliament.
Olper, A. et al. (2012)
Does the Common Agricultural Policy Reduce Farm Labour Migration? Panel data analysis across EU regions
, Comparative Analysis of Factor Markets for Agriculture across the Member States No. 28.
Orgiazzi et al. (2016)
A knowledge-based approach to estimating the magnitude and spatial patterns of potential threats to soil biodiversity
, Science of the Total Environment, Volumes 545-546.
Oullier, O. (2013). Behavioural insights are vital to policy-making, Nature, 501(7468).
Paggliaci, F. (2017)
Regional paths towards Europe 2020 targets: a spatial approach
, European Planning Studies, Volume 25, Issue 4.
Panagos P. et al. (2015)
The new assessment of soil loss by water erosion in Europe
, Environmental Science & Policy 54, Volume 58.
Panagos P. et al. (2018)
Cost of agricultural productivity loss due to soil erosion in the European Union: From direct cost evaluation approaches to the use of macroeconomic models
, Land Degradation and Development., Volume 1, Issue 14.
Panagos, P. et al. (2015)
Estimating the soil erosion cover-management factor at European scale
, Land Use policy Volume 48C.
Panagos, P. et al. (2016)
Soil Conservation in Europe: Wish or Reality?
Land Degradation and Development, Volume 27, Issue 6.
Pannell, D.J. et al. (2006)
Understanding and promoting adoption of conservation practices by rural landholders
, Australian Journal of Experimental Agriculture, Volume 46, Issue 11
Pe’er, G. et al. (2017)
Is the CAP fit for purpose? An evidence-based fitness check assessment
, Leipzig, German Centre for Integrative Biodiversity Research (iDiv), Halle-Jena-Leipzig.
Pérez Domínguez, I. et al. (2016)
An economic assessment of GHG mitigation policy options for EU agriculture (EcAMPA 2)
, Science for Policy Report, European Commission, Joint Research Centre (JRC).
Petrick, M. and Zier, P. (2011) "
Regional employment impacts of Common Agricultural Policy measures in Eastern Germany: a difference-in-differences approach
",
Agricultural Economics
, volume 42, issue 2.
Piorr A. et al. (2011)
Peri-urbanisation in Europe: Towards a European Policy to sustain Urban-Rural Futures
, PLUREL, University of Copenhagen / Academic Books Life Sciences
Poláková, J. et al. (2011)
Addressing biodiversity and habitat preservation through Measures applied under the Common Agricultural Policy
, Study to the European Commission.
Putnam, R. (1993) La tradizione civica nelle regioni italiane, Milan, Mondadori.
Ramboll (2006)
Study to assess the administrative burden on farms arising from the CAP
Study to the European Commission.
Renwick, A. et al., (2012)
Policy reform and agricultural land abandonment in the EU
Ronzon, T. et al. (2015)
The Bioeconomy in the European Union in numbers. Facts and figures on biomass, turnover and employment
. European Commission, Joint Research Centre, Institute for Prospective Technological Studies, Spain.
Ronzon, T. et al. (2017)
A systematic approach to understanding and quantifying the EU’s bioeconomy. Bio-based and Applied Economics
, volume 6, n°1.
Rossi R. (2017)
Women and their roles in rural areas
, European Parliamentary Research Service.
Roza, P. et al. (2012)
Simplification of the CAP, Assessment of the European Commission's reform proposals
, LEI Wageningen.
Sanders, J et al. (2016)
Distribution of the added value in the organic food chain
, Study to the European Commission
Schmitzberger et al. (2005)
How farming styles influence biodiversity maintenance in Austrian agricultural landscapes
Agriculture, Ecosystems & Environment, Volume 108, Issue 3.
Schrijver et al. (2016)
Precision agriculture and the future of farming in Europe
, Scientific Foresight Study, European Parliamentary Research Service.
Schulz et al. (2013)
Assessing farmers' willingness to accept "greening" insights from a discrete choice experiment in Germany
, Agricultural Economics, Volume 65, Issue 1.
Shucksmith, M. et al. (2009); Novo-Corti et al.(2014) according to Clifton, J. et al. (2015)
Public infrastructure services in a territorial perspective: Analysis in the EU context
.
Slavova, D. (2017)
Ex-Post evaluations on Rural Development Programmes 2007-2013
, Information report for the European Economic and Social Committee.
Söderberg, T. (ed.) (2016),
Greening of the CAP in practice – costs versus environmental benefits
, Report 2016:18Eng, Jönköping, Swedish Board of Agriculture.
Standing Committee for Agricultural Research (SCAR) (2017)
Policy brief on the Future of Advisory Services
, Strategic Working Group on Agricultural Knowledge and Innovation Systems.
Standing Committee on Agricultural Research (SCAR) (2016)
Agricultural knowledge and innovation systems: Towards the future. A foresight paper
, Strategic Working Group AKIS, Study to the European Commission.
Stewart, D. W. et al. (2014)
Focus groups: Theory and practice
, Sage publications.
Stolte, J. et al. (2016)
Soil threats in Europe – Status, methods, drivers and effects on ecosystem services,
JRC Technical reports, European Commission, Joint Research Centre (JRC).
Sucksmith, M. (2010) How to promote the role of youth in rural areas of Europe, Study to the European Parliament.
Sutton, M. et al. (2011)
The European Nitrogen Assessment: Sources, Effects and Policy Perspectives
, Cambridge University Press.
Sweco, et al. (2017)
Use of new provisions on simplification during the early implementation phase of ESIF
, Study to the European Commission.
Swinnen, J. et al. (2008).
Study on the functioning of land markets in the EU Member States under the influence of measures applied under the Common Agricultural Policy
. Final report. Centre for European Policy Studies (CEPS).
Swinnen, J. et al. (2013)
Possible effects on EU land markets of new CAP direct payments
, Study to the European Parliament.
Terluin, I. et al. (2017)
Flexibility given to Member States - state of play and perspectives
, Study to the European Parliament
Terres, JM. et al. (2013)
Assessing the risk of farmland abandonment in the EU
, Scientific and Policy Reports, European Commission, Joint Research Centre (JRC)
The James Hutton Institut et al. (2015)
Prospect for farmers' support: Advisory Services (PROAKIS)
, website.
The N2K Group (2016)
Integration of Natura 2000 and biodiversity into EU funding (EAFRD, ERDF, CF, EMFF, ESF). Analysis of a selection of operational programmes approved for 2014-2020
, Study to the European Commission.
Tomka, B. (2013) A Social History of Twentieth-Century Europe, Routledge, Taylor and Francis Group, London and New York.
Trouvé A. et al. (2016)
Etude sur les mesures contre les déséquilibres de marché : quelles perspectives pour l'après quotas dans le secteur laitier européen?
Study to the Ministry of Agriculture and Food.
United Nations (2016)
Report of the Inter-Agency and Expert Group on Sustainable Development Goal Indicators (E/CN.3/2016/2/Rev.1) Annex IV: Final list of proposed Sustainable Development Goal indicators
, University Press, Cambridge, United Kingdom and New York, USA.
United States Department of Agriculture (USDA)
Farm Bill Home
, Farm Service Agency, website.
Van Bavel, R. et al. (2018)
Applying behavioural sciences to EU policy-making
, JRC Science for Policy.
Walsh, K. et al. (2013)
Employment and social inclusion in rural areas: a fresh start
, POBAL, Government supporting communities.
Wiest, K. (2016)
Women and migration in Rural Europe. Labour Markets, Representations and Policies
, New Geographies of Europe.
Wiggering, H. et al. (2005)
Indicators for multifunctional land use - Linking socio-economic requirements with landscape potentials
, Ecological Indicators 6.
Wijnands, Jo H.M. et al (2017)
Analyses of the Functioning of Milk Package provisions as regards Producer Organisations and collective negotiations
, European Commission, Joint Research Centre (JRC).
World Bank on the European Union (2017)
Thinking CAP Supporting Agricultural Jobs and Incomes in the EU
, EU Regular Economic Report 4.
Wreford, A. et al., (2017)
Overcoming barriers to the adoption of climate-friendly practices in agriculture
. OECD Food, Agriculture and Fisheries Papers, n°101.
Zawalińska K. (2017)
Territorial cohesion through lenses of the CAP and rural areas
, workshop organised by Directorate General of Agriculture and Rural Development.
Annex 10 – Glossary
|
Term or acronym
|
Meaning or definition
|
|
Administrative burden
|
Costs incurred by enterprises, the voluntary sector, public authorities and citizens in meeting legal obligations to provide information on their activities, either to public authorities or to private parties, and resulting from collecting and processing information which would not be done in the absence of a legal obligation.
|
|
Advisory services
|
These are services intended to assist farmers (as well as forest holders and small and medium enterprises in rural areas) to improve the economic and environmental performance of their holdings. These services provide tailor-made advice, taking into consideration the specificities of the farm, to contribute to the sustainability and climate friendliness of the holding. The scope of the advice covers any economic, environmental and social aspect that a beneficiary may need to develop his or her activity.
|
|
AECM
|
Agri-Environment and Climate Measure:
These are practices, undertaken voluntarily by farmers, over a set period. Support may be provided through Rural Development programmes. The practices bring environmental benefits and /or help to mitigate and adapt to climate change. The payments compensate farmers for the extra costs that they incur and the income that they forego when they undertake these practices. The practices must go beyond a number of obligations which apply to farmers in any case – including (but not limited to) cross-compliance and relevant national legislation. A given practice which is funded through the greening provisions of pillar I may not also be funded through an agri-environment-climate measure.
|
|
AKIS
|
“Agricultural Knowledge and Innovation System” means the combined organisational context and interaction of stakeholders who use and produce knowledge and innovation for agriculture and rural areas, including farmers, advisors, trainers, researchers, and other agricultural experts. The scope of the knowledge exchange and innovation within AKIS reaches out to EU, national, regional, and local levels and covers issues related to agriculture and wider rural concerns, including environment, climate change, energy supply, agri-food or bio-based value chains, and rural businesses opportunities.
|
|
ANC
|
Areas with Natural or other Specific Constraints:
These are areas where farming is handicapped by a natural or other specific constraint. The areas have to be delimited by member states on the basis of eight biophysical criteria (e.g. slope), with some flexibility for member states to use other criteria for up to 10% of their agricultural area. Before the 2013 reform of the Common Agricultural Policy, such areas were known as ʽLess Favoured Areasʼ (LFAs) and were defined under much vaguer criteria – a fact criticised by the European Court of Auditors.
In these areas, farmers face higher costs of production and are eligible for compensatory payments calculated on the basis of the additional costs incurred and income foregone.
There are three different categories of such area:
1. mountain areas, which are handicapped by altitude, difficult climatic conditions and a short growing season;
2. areas, other than mountain areas, facing significant natural constraints;
3. other areas which face specific constraints and where the land needs to be managed in order to conserve or improve the environment, to maintain the countryside, to preserve the potential for tourism or to protect the coastline.
|
|
BPS
|
Basic Payment Scheme:
Under the 2007-2013 rules of the Common Agricultural Policy, farmers received direct payments under either the Single Payment Scheme or the Single Area Payment Scheme. The 2013 reform of the Common Agricultural Policy replaced the Single Payment Scheme with the Basic Payment Scheme which came into effect as from 2015. The Basic Payment Scheme is operated on the basis of payment entitlements allocated to farmers in the first year of application of the scheme and activated each year by farmers.
Eligibility for the Basic Payment Scheme or, as the case may be, the Single Area Payment Scheme is a precondition for farmers to receive other direct payments such as the green direct payment, the redistributive payment, the payment for areas with natural or other specific constraint and the payment for young farmers.
|
|
CAP
|
Common Agricultural Policy (CAP):
This is the set of legislation and practices adopted by the European Union to provide a common, unified policy on agriculture. The initial measures were introduced in 1962. Since then, the policy has been adapted and developed and has undergone a number of reforms.
The overall objective is to ensure that agriculture can be maintained over the long term at the heart of a living countryside.
The European Union is obliged by law to have an agricultural policy. Article 38 (4) of the Treaty on the Functioning of the European Union states that ʽthe operation and development of the internal market for agricultural products must be accompanied by the establishment of a Common Agricultural Policy.ʼ
The aims are as follows (article 39):
1. an increase in agricultural productivity by means of technical progress and the rational development of agricultural production,
2. a fair standard of living for the agricultural community,
3. the stabilisation of markets for farm products,
4. food security (i.e. ensuring that there is always a supply of food),
5. food affordability (i.e. that the price of food is at a level that people can afford).
|
|
CAP Plan
|
(there is no ready made definition)
|
|
Capping
|
The 2013 reform of the Common Agricultural Policy granted member states the option to ʽcap,ʼ i.e. to limit, the amount of the Basic Payment that any farmer receives. The funds ʽsavedʼ under this mechanism stay in the member state concerned and are transferred to the Rural Development envelope. Capping is voluntary for member states and is a specific application of
degressivity (see modulation, transfers between pillars).
|
|
Carbon preservation and sequestration
|
Process involved in carbon capture and the long-term storage of atmospheric carbon dioxide or other forms of carbon to mitigate or defer global warming.
|
|
CDG
|
Civil Dialogue Groups:
These are groups of representatives of organisations at European level from civil society. The organisations include professional associations and other non-governmental organisations which are involved in farming, the rural economy, food production, food processing, agricultural trade, the environment, consumer protection and other related matters. They meet with the services of the Commission several times a year.
There are 13 such groups. They play an advisory and consultative role - they are not involved in the drafting or approval of legislation.
|
|
CLLD
|
Community-Led Local Development :
A coherent set of operations to meet local objectives and needs, which contributes to meeting the European Union strategy for smart, sustainable and inclusive growth, and which is designed and implemented by a local action group (LAG).
|
|
CMEF
|
Common Monitoring and Evaluation Framework:
The horizontal regulation (Regulation (EU) No 1306/2013, Article 110) establishes a common monitoring and evaluation framework with a view to measuring the performance of the CAP. It covers all instruments related to the monitoring and evaluation of CAP measures and in particular direct payments, market measures and rural development measures.
|
|
CMES
|
Common Monitoring and Evaluation System:
For rural development, the monitoring and evaluation system is set out by: the common provisions regulation (Regulation (EU) No 1303/2013), which defines the common monitoring and evaluation elements for the European Structural and Investment Funds (ESIF); and the rural development regulation (Regulation (EU) No 1305/2013), which addresses the specificities for the rural development programmes.
|
|
CMO
|
Common Market Organisation
A common market organisation is a set of measures that enables the European Union to monitor and manage, either directly or indirectly (via producer organisations supported by operational programmes), the markets of agricultural products. The rules are laid down in the regulation on the single common market organisation.
The purpose of market management is to stabilise markets (in terms of quantity offered and purchased and the price at which transactions take place) and thus to ensure, on the one hand, that farmers do not suffer from excessively low prices and, on the other, that consumers have a secure supply of food at reasonable prices.
Until 2007, the European Union operated 21 common market organisations which together covered around 90% of the output of farms. With a view to make things simpler, the European Union has amalgamated these 21 common market organisations into a single set, known as the single common market organisation.
|
|
Cover crops
|
crops planted as an intermediate crop primarily to manage soil erosion, soil quality, water quality, weeds, pests and biodiversity.
|
|
CO2 emissions
|
Carbon dioxide emissions, the most long-lived greenhouse gas in the Earth's atmosphere.
|
|
Crop diversification
|
Growing a variety of crops on the arable land of a farm in one single season, refers to one of the greening measures in the current CAP.
|
|
Crop rotation
|
An agricultural technique in which, season after season, each field is sown with successive crops in a regular rotation, each crop being repeated at intervals of several years.
|
|
Cross-compliance
|
In order to receive direct payments and some other forms of support, farmers are required to respect certain rules. This requirement is known as cross-compliance. These rules concern food safety, animal health, plant health, the climate, the environment, the protection of water resources, animal welfare and the condition in which farmland is maintained.
There are two components of these rules: statutory management requirements and good agricultural and environmental conditions. If a farmer is found not to respect these rules, his or her direct payments may be reduced.
|
|
Decoupling
|
Introduced by the 2003 reform of the Common Agricultural Policy, decoupling is the removal of the link between the receipt of a direct payment and the production of a specific product. Prior to this reform, farmers received a direct payment only if they produced the specific product to which the direct payment was associated. It meant that the profitability of producing a product (cereals, beefmeat...) did not depend only on the price at which the farmer could sell the product in the market, but also on the amount of the direct payment that was associated with that particular product.
The 2003 reform decoupled many direct payments from production and this process was continued in the 2009 health check. The overall effect of decoupling has been to move the agricultural sector more towards the free market and to give farmers greater freedom to produce according to market demand.
The health check permitted member states to continue to couple a small number of direct payments to production (for instance the suckler cow premium and the sheep and goat premium). The possibility of keeping a link between production and direct payments was maintained in the 2013 reform. The reason is to support the continued production of particular products so as to avoid land falling out of farming in vulnerable regions
|
|
Degressivity
|
The 2013 reform of the Common Agricultural Policy stipulated that the direct support (basic payment scheme and single area payment scheme) that any farmer is entitled to receive is to be reduced by at least 5% of the amount of the payment above EUR 150 000. In order to take employment into account, the farmer can deduct the costs of salaries in the previous year (including taxes & social security contributions) before this reduction is applied. Member states using more than 5% of their annual national ceiling to grant a redistributive payment are not required to apply this reduction. The funds thus ʽsavedʼ stay in the member state concerned and are transferred to the Rural Development envelope (see capping, modulation, transfers between pillars).
|
|
Direct payments
|
Direct payments were established by the 1992 reform of the Common Agricultural Policy. Prior to this reform, the Common Agricultural Policy supported prices: i.e. the prices at which farmers sold their products in the market (such support is therefore not paid directly to farmers). The 1992 reform reduced the level of price support. To prevent a corresponding fall in the incomes of farmers, direct payments were introduced.
Nowadays, direct payments are granted to farmers in order to support their incomes and to remunerate them for their production of public goods.
|
|
EAFRD
|
European Agricultural Fund for Rural Development:
This fund was created in September 2005 and came into operation at the beginning of 2007. It replaced the Guidance Section of the European Agricultural Guidance and Guarantee Fund and that part of the guarantee section from which some of the Rural Development measures had been funded. It is the single source of funding from the European Union for Rural Development.
|
|
EAGF
|
European Agricultural Guarantee Fund:
This fund was created in September 2005 and came into operation at the beginning of 2007. It replaced the guarantee section of the European Agricultural Guidance and Guarantee Fund. It provides funding for direct payment to farmers, for the management of the agricultural markets and for a number of other purposes such as veterinary and plant health measures, food programmes and information activities.
|
|
Ecological focus area
|
Since 2015, every farmer in the European Union who claims a direct payment and has more than 15 hectares of arable land is obliged to have 5% of his arable land covered by ecological focus areas. These are areas which bring benefits for the environment, improve biodiversity and maintain attractive landscapes (such as landscape features, buffer strips, afforested areas, fallow land, areas with nitrogen-fixing crops etc.). Some exceptions to this general rule apply, for example to farmers who have more than 75% of their area under grassland.
The obligation to have 5% of land covered by ecological focus areas may be increased to 7 % subject to a European Commission report in 2017 and a legislative proposal from the Commission. This obligation is one of three ʽgreeningʼ measures of the Common Agricultural Policy 2014-2020 - the others being the maintenance of permanent grassland and crop diversification.
|
|
EIP-AGRI
|
European Innovation Partnership for Agricultural Productivity and Sustainability:
The purpose of the European innovation partnership is to promote a) the productivity and efficiency of the agricultural sector and b) the sustainability of agriculture (securing soil functionality at a satisfactory level by 2020).
In order to promote agricultural productivity and sustainability, the European innovation partnership provides a working interface between agriculture, bio-economy and science at regional, national and European Union level. It also serves as a catalyst to enhance the effectiveness of innovation-related actions supported by Rural Development programmes as well as by research and innovation activities supported by the European Union.
Implementation is channelled through operational groups as key acting entities, involving actors such as farmers, scientists, advisers, non-governmental organisations and enterprises. The operational groups constitute themselves around topics of interest and carry out projects aimed at testing and applying innovative practices, processes, products, services, and technologies. At cross-border or European Union level, operational groups act in particular through cluster initiatives and pilot and demonstration projects.
|
|
Emission leakage
|
Increase of emissions outside the countries taking domestic mitigation or other policy actions
|
|
ESIF
|
European Structural and Investment Funds:
These include the following funds of the European Union: the European Agricultural Fund for Rural Development, the European Regional Development Fund, the European Social Fund, the Cohesion Fund and the European Maritime and Fisheries Fund.
|
|
Ex-ante conditionality
|
These are certain prior conditions which should be met in the context of Rural Development programmes. They match essential elements to be in place in order to guarantee the correct implementation of Rural Development programmes and their measures. For example, the definition of baseline conditions for the implementation of agri-environmental-climate measures is an ex-ante conditionality for such a measure.
|
|
External Convergence
|
Introduced by the 2013 reform of the Common Agricultural Policy, the term external convergence refers to making the policy fairer between member states.
The policy becomes fairer because the national envelopes for direct payments are progressively adjusted either upwards or downwards to bring them close to the average level for the European Union. The national envelopes of those member states where the average payment (in EUR per hectare) is below 90% of the average are gradually increased (by one third of the difference between their current rate and 90% of the average). The national envelopes for member states receiving above average amounts are correspondingly adjusted downwards. There is a guarantee that every member state reaches a minimum average level of direct payment at national or regional level by 2019.
|
|
FADN
|
Farm Accountancy Data Network:
The farm accountancy data network provides data on the financial and economic aspects of various types of farming in the member states of the European Union. Each year a sample of farms is selected which is representative of commercial farms. These farms provide data on their costs of production, their revenues from sales and other aspects of their farming operations. The data enable the European Union to monitor the income situation of farmers and to examine the effects of the Common Agricultural Policy.
|
|
Farmer
|
In the context of the Common Agricultural Policy, a farmer is an individual (or group of individuals e.g. partnerships, companies, and other legal structures through which a business is conducted) whose holding is situated with the territory of the European Union and who exercises an agricultural activity.
|
|
Farm sustainability tool for nutrient management (Nutrient Management Plan)
|
Tool at farm level that can be used to increase the efficiency of the use of all nutrient sources a crop uses while at the same time reducing production costs and environmental risk.
|
|
FAS
|
Farm Advisory System: system for advising beneficiaries on land management and farm management. That farm advisory system can be operated by designated public bodies and/or selected private bodies.
|
|
Financial discipline mechanism
|
This is a mechanism for ensuring that the expenditure under the provisions of the Common Agricultural Policy does not exceed the limits specified in the European Union budget.
|
|
Financial instruments
|
Measures of financial support provided on a complementary basis from the budget of the European Union in order to address one or more policy objectives. Such instruments may take the form of loans, guarantees, equity or quasi-equity investments, or other risk-sharing instruments, and may, where appropriate, be combined with grants.
|
|
GAEC
|
Good Agricultural and Environmental Condition:
Farmers are obliged to maintain their land in ʽgood agricultural and environmental condition.ʼ This concept includes the following: the protection of soil against erosion, the maintenance of soil organic matter and soil structure, and the safe-guarding of landscape features. It is the member states - not the European Union - which decide the exact specification of these parameters.
|
|
Greening
|
The 2013 reform of the Common Agricultural Policy introduced several instruments to promote environmental sustainability and combat climate change. These instruments comprise a green direct payment, enhanced cross-compliance obligations, an obligation to allocate 30% of the Rural Development budget to projects and measures that are beneficial for the environment and climate change (including voluntary agri-environment-climate measures), training measures and support from the farm advisory services
|
|
Governance bodies
|
This covers accredited Paying Agencies and where applicable, Coordinating Bodies, Certification Bodies, Competent Authorities.
|
|
Horizontal Regulation
|
This regulation sets out the general rules on the financial management and budgetary aspects of the two pillars of the Common Agricultural Policy (the European Agricultural Guarantee Fund and the European Agricultural Fund for Rural Development). It concerns financial corrections and controls as well as procedures for the prevention, detection and correction of irregularities and the application of penalties.
The regulation provides also for common rules on farm advisory services, cross-compliance and the integrated administration and control system. It sets the basis for the publication of information of the beneficiaries of the Common Agricultural Policy and establishes a common monitoring and evaluation framework with a view to measuring the performance of the policy.
|
|
IACS
|
Integrated Administration and Control System:
This is an obligatory system used by member states for the management and control of payments made to farmers under the Common Agricultural Policy, using advanced techniques to check parcels by aerial or satellite photography, and to cross-check farmersʼ claims with computer databases. Specifically, the integrated administration and control system ensures that payment irregularities are revealed and that queries are followed up. In this way, payments to farmers are made correctly and any amounts which have been unduly paid are recovered.
|
|
Internal convergence
|
The 2013 reform of the Common Agricultural Policy introduced the requirement that the value of per hectare payment entitlements for the Basic Payment Scheme, within a member state, must move towards a more uniform level. To achieve this, member states could choose from different options: to apply a national or regional flat rate from 2015; to achieve a regional or national flat rate by 2019, or to ensure that those farms receiving less than 90% of the regional or national average rate see a gradual increase – with the additional guarantee that normally each payment entitlement reaches a minimum value of 60% of the national or regional average by 2019. The amounts for farmers above the regional or national average are adjusted, with an option for member states to limit the loss to 30%.
|
|
JRC
|
Joint Research Centre (European Commission)
|
|
LEADER
|
Links between actions for the development of the rural economy:
This term is a French acronym meaning Liaison Entre Actions de Développement de lʼEconomie Rurale (in English: ʽLinks between actions for the development of the rural economyʼ).
It is a community-led local development method for mobilising and developing rural communities through local public-private partnerships (local action groups). It helps rural people, groups and enterprises to consider the potential of their area and to encourage the implementation of integrated and innovative local development strategies.
In its first two generations as a Community initiative (Leader I: 1991-93 followed by Leader II: 1994-99) it was focused on disadvantaged rural areas. In 2000-2006 (Leader+), the method was expanded to cover all types of rural area. The approach was then mainstreamed in 2007- 2013, as an integral part of the European Unionʼs Rural Development programmes, covering some 2 200 rural territories across 27 member states. In 2007, Leader was extended to the fisheries sector.
During the period 2014 - 2020, Leader continues under Rural Development. It is also available under the cohesion policy as a common instrument called community-led local development.
|
|
LPIS
|
Land Parcel Information System:
This computer database contains all agricultural areas that are eligible for a direct payment under the Common Agricultural Policy. It is used to cross-check the parcels for which payments have been claimed by the farmer. The land parcel identification system ensures that the farmer is paid for the correct area and that overpayment is avoided.
|
|
LULUCF
|
Land Use, Land Use Change and Forestry:
The term is defined by the United Nations climate change secretariat as ʽa greenhouse gas inventory sector that covers emissions and removals of greenhouse gases resulting from direct human-induced land use, land-use change and forestry activitiesʼ.
Similar to other economic sectors, land use, land use change and forestry has impacts on the global carbon cycle. The activities included in land use, land use change and forestry can add or remove greenhouse gases from the atmosphere, affecting climate change in either a negative or positive way
|
|
Nitrogen surplus
|
The difference between all nitrogen inputs and outputs on agricultural land
|
|
Operational group
|
These are groups of farmers, researchers, advisors and businesses in the agri-food sector. They receive Rural Development funding to run projects within the framework of a European innovation partnership
|
|
Permanent crops
|
In the context of the Common Agricultural Policy, the term permanent crops means non-rotational crops other than permanent grassland and permanent pastures which occupy the land for five years or more and which yield repeated harvests, including nurseries and short rotation coppice.
|
|
Permanent grassland
|
Permanent grassland can be defined as land not included in the crop rotation of the holding for five years or more, used to grow grasses or other herbaceous forage naturally (self-seeded) or through cultivation (sown). It may include other species such as shrubs and/or trees which can be grazed or produce animal feed.
|
|
Pillars
|
Pillars (in the context of the Common Agricultural Policy): The Common Agricultural Policy comprises two ʽpillars.ʼ The first pillar is support to farmersʼ incomes. This support is provided in the form of direct payments and market measures and is entirely financed from the European Agricultural Guarantee Fund. The second pillar is the support provided for the development of rural areas. This support takes the form of Rural Development programmes and is co-financed from the European Agricultural Fund for Rural Development.
|
|
PO
|
Producer organisation:
A legally-constituted group of farmers and growers. Producer organisations assist in the distribution and marketing of products. They also promote a higher quality of products and encourage their members to adopt good environmental practices. Producer organisations have been legally encouraged since 2001 in the fruit and vegetable sector, and since 2011 in the milk sector (see milk package).
Since the 2013 reform of the Common Agricultural Policy, producer organisations are now encouraged in all sectors. Producer organisations can group themselves into associations of producer organisations and into inter-branch organisations.
|
|
POSEI
|
Programmes d'Options Spécifiques à l'Eloignement et à l'Insularité (for Outermost Regions) :
This is a scheme that supports the incomes of farmers in the outermost regions of the European Union and the supply of essential products to those regions. It is the French acronym for Programmes dʼOptions Spécifiques à lʼEloignement et à lʼInsularité. The scheme seeks to compensate farmers for their extra costs of production and marketing due to the small size of these territories, their difficult topography and climate, and the long distance to European markets.
|
|
RDP
|
Rural Development Programme:
The Rural Development programmes define multi-annual strategies in selected programming areas, based on a thorough analysis of their socio-economic and environmental needs. The strategies implemented under each Rural Development programme aim at meeting the European Union priorities for Rural Development through a number of selected measures. The programmes also lay down the conditions that potential beneficiaries have to meet if they are to benefit from Rural Development funds.
|
|
Redistributive payment
|
In order to redistribute support to smaller farmers, member states may allocate up to 30% of their national budget to a redistributive payment for the first hectares. The number of hectares for which this payment could be allocated will be limited to 30 hectares or the average farm size in member states if the latter is more than 30 hectares. The amount per hectare cannot exceed 65% of the average payment per hectare.
|
|
Risk management toolkit
|
The toolkit covers:
1) Financial contributions to premiums for crop, animal and plant insurance against economic losses incurred by farmers and caused by adverse climatic events, animal or plant diseases, pest infestation, or an environmental incident,
2) Financial contributions to mutual funds, to compensate farmers for economic losses caused by adverse climatic events, animal or plant diseases, pest infestations or environment incidents,
3) An income stabilisation tool to compensate farmers for a severe drop in income.
|
|
Rural Development measures
|
The Rural Development measures are defined in the Rural Development regulation and represent the main instruments to implement the Rural Development programmes. For the programming period 2014 – 2020, the number of measures has been reduced compared to the previous programming period. Furthermore, there is now more flexibility in how the measures are used. This increases their effectiveness in meeting specific priorities.
A range of different types of support is offered by the menu of Rural Development measures to address the many needs of the rural areas of the European Union. Member states have to programme these measures to ensure that they help to achieve one or more European Union priorities for Rural Development and to meet the needs of rural areas.
Member states have a certain discretion regarding the final design of these measures. The support granted under each measure is shared between the European Union and the member state concerned. This arrangement is known as co-financing.
|
|
SAPS
|
Single area payment scheme (SAPS):
Due to limited administrative capacities and the absence of historical data, new member states (i.e. those that joined the European Union in 2004 and 2007) were granted the possibility of applying the single area payment scheme instead of applying the standard direct payment schemes. The single area payment scheme provides a flat-rate decoupled area payment paid for eligible agricultural land and replaces almost all payments granted in other than new member states.
Under Regulation (EC) No 73/2009, the single area payment scheme was foreseen to expire. However, the 2013 reform of the Common Agricultural Policy permitted member states applying the single area payment scheme in 2014 to apply it until 2020. At present, the single area payment scheme is applied by all new member states except Slovenia, Malta and Croatia.
|
|
SMR
|
Statutory Management Requirements
The statutory management requirements form part of cross-compliance and are laid down in a number of European Union directives and regulations. They concern public health, animal and plant health, identification and registration of animals, environment and animal welfare. These requirements apply independently of cross compliance (which only establishes the link between the full payment and the respect of such requirements).
|
|
VCS
|
Voluntary Coupled Support:
Payment to certain hectares of crop or heads of animal according to the rules laid down under Title IV chapter 1 of Regulation EU 1307/2013.
|